Figures & data
Table 1. Pearson correlations among dimensions within the parent and youth versions of the Child and Adolescent Dispositions Scales (CADS) in the Tennessee twins study (N = 4,049) (Lahey et al., Citation2008, Citation2010).
Figure 1. Cross-cutting associations between 10 dimensions of parent-rated psychological problems and three parent-rated CADS dispositional dimensions, adjusting for age, sex, family income, and race-ethnicity in 9–17 year old participants in the Tennessee twin study. Dimensions of dispositions were standardized to mean of 0 and standard deviation of 1. Arrows between dispositions and problem dimensions are quantified as standardized regression coefficients that were significant after 5% FDR correction for the 30 tests of associations (dashed lines represent significant inverse associations).
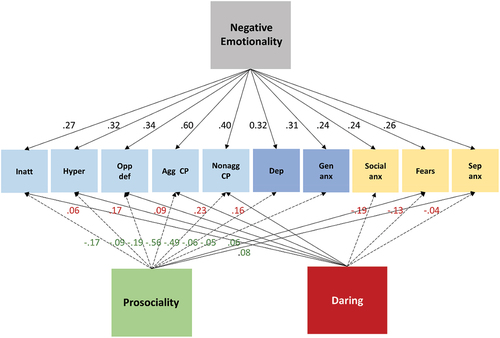
Figure 2. Cross-cutting associations between 10 dimensions of parent-rated psychological problems and three youth self-rated CADS dispositional dimensions, adjusting for age, sex, family income, and race-ethnicity in 9–17 year old participants in the Tennessee twin study. Dimensions of dispositions were standardized to mean of 0 and standard deviation of 1. Arrows between dispositions and problem dimensions are quantified as standardized regression coefficients that were significant after 5% FDR correction for the 30 tests of associations (dashed lines represent significant inverse associations).
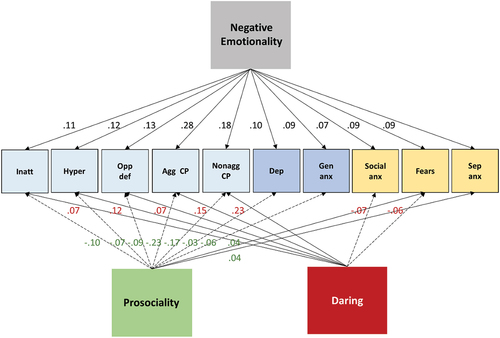
Figure 3. Plots of parent ratings of aggressive (top) and nonaggressive (bottom) DSM-IV conduct disorder behaviors (means and standard errors of ratings of child and adolescent psychopathology scale items transformed to a 0–3 scale) against sample deciles of parent-rated negative emotionality and prosociality among 6–17 year olds in the Tennessee Twins study, adjusted for clustering within twin pairs. Dotted lines are best-fit exponential lines.