
Figures & data
Table 1. Mechanical properties of air as an ideal gas [Citation41].
Table 2. Material properties of TNT [Citation41].
Table 3. Properties of lightweight concrete [Citation29].
Figure 1. (a) Standard compressive test results (stress-strain) for lightweight concrete with a density of 500 kg/m3 [Citation29]. (b) Peripheral boundary condition of the tunnel. (c) Fluid flow in pressure pipes with zero velocity at the boundaries (adapted from Brode [Citation42]). (d) Zero-velocity boundary condition on Eulerian parts. (e) Minimum, maximum, and mean pressure-time diagrams.
![Figure 1. (a) Standard compressive test results (stress-strain) for lightweight concrete with a density of 500 kg/m3 [Citation29]. (b) Peripheral boundary condition of the tunnel. (c) Fluid flow in pressure pipes with zero velocity at the boundaries (adapted from Brode [Citation42]). (d) Zero-velocity boundary condition on Eulerian parts. (e) Minimum, maximum, and mean pressure-time diagrams.](/cms/asset/a41c977a-d1b9-4f2b-8e50-398b6c9d3218/umcm_a_2125134_f0001_c.jpg)
Figure 2. (a) Cross-sectional and profile views of the tunnel model. (b) Pressure-time diagram at a distance of 2.25 m from the detonation point: (i) Li’s experimental results [Citation43], (ii) Liu’s numerical results [Citation41], and (iii) the numerical results of the present study. (c) Pressure-time diagram at a distance of 6.25 m from the detonation point: (i) Li’s experimental results [Citation43], (ii) Liu’s numerical results [Citation41], and (iii) the numerical results of the present study.
![Figure 2. (a) Cross-sectional and profile views of the tunnel model. (b) Pressure-time diagram at a distance of 2.25 m from the detonation point: (i) Li’s experimental results [Citation43], (ii) Liu’s numerical results [Citation41], and (iii) the numerical results of the present study. (c) Pressure-time diagram at a distance of 6.25 m from the detonation point: (i) Li’s experimental results [Citation43], (ii) Liu’s numerical results [Citation41], and (iii) the numerical results of the present study.](/cms/asset/5cce379d-21d4-4b2e-85fe-0f0658ac7695/umcm_a_2125134_f0002_c.jpg)
Table 4. Maximum pressure and wave arrival time at different distances from the detonation point.
Figure 3. Geometry of the tunnel and arrangement of the explosive, concrete wall, and pressure study surface.
Figure 4. (a-b) Pressure-time diagram for various explosive charges in models (a) with a wall, and (b) without a wall. (c) Peak pressure bar chart for various explosive charges.

Figure 5. (a) Normalized peak pressure and peak pressure reduction of the base and wall-protected models for various explosive charges. (b) Pressure-time diagram of the base model for a charge mass of 1000 kg (benchmark base model).
Figure 6. (a) Protective walls with various heights. (b) Pressure-time diagram for various numbers of block rows. (c) Pressure reduction percentage bar chart for various numbers of block rows.
Figure 7. (a) Pressure-time diagrams for various for different distances of the wall from the detonation point (inset on top-left corner shows the concrete wall layout). (b &c) Pressure contours in the tunnel with the wall at distances of 10 and 30 m, respectively.
Figure 8. Comparative representation of pressure values for different locations of the protective wall. (a) Values of the first and second peak pressures and their respective ratios (inset). (b) Reduction percentages of the first and second peak pressures.
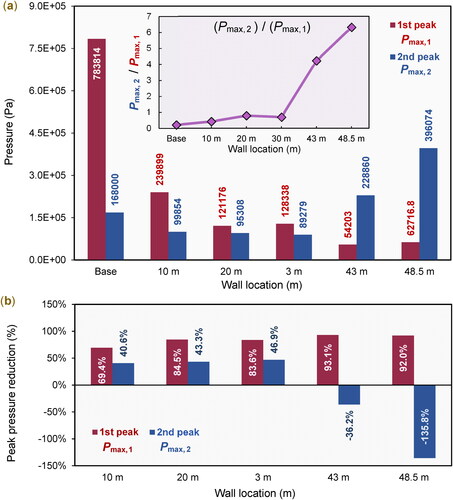
Figure 9. (a-c) Pressure-time diagrams for different area coverages at various distances. (d-e) Pressure contours across the tunnel for a seamless wall at the beginning of the split.
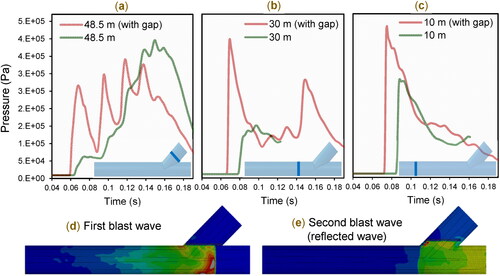
Figure 10. Different locations of the concrete wall in the main tunnel (top) and the branch tunnel (bottom).

Figure 11. Pressure-time diagram for various wall locations: (a) selected wall locations in the main and branch tunnels; (b) selected wall locations in the main tunnel; and (c) selected wall locations in the branch tunnel.
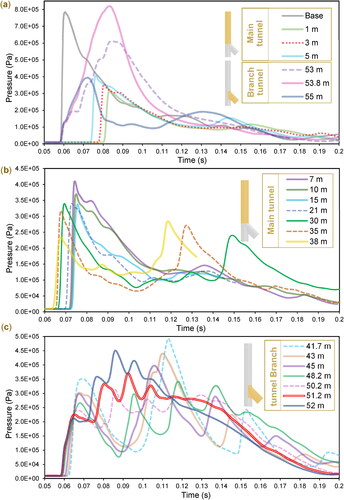
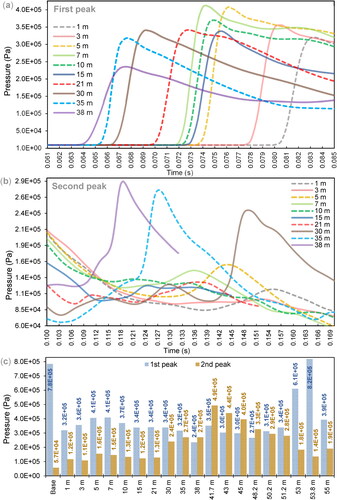
Figure 12. Pressure-time diagrams around (a) the first, and (b) the second peak pressure. (c) The first and second peak pressure values for various locations.
Data availability statement
Some or all data, models, or code that support the findings of this study are available from the corresponding author upon request.