Figures & data
Figure 1. Developmental toxicity of genistein on zebrafish embryos. The zebrafish embryos at 24 h post-fertilization were exposed to genistein (1 3 10−4 M, 0.5 3 10−4 M, 0.25 3 10−4 M) or vehicle (ethanol, 0.1%) for 60 h. (A) Heart rates of genistein-treated embryos at 30 h after treatment decreased in dose-dependent manner. (B) Although about 90% of vehicle-treated embryos hatched at 37 h after treatment, genistein treatment decreased the number of hatched embryos. (C) Body lengths of genistein-treated embryos at 37 h after treatment decreased in a dose-dependent manner. (D) At 60 h after genistein treatment, all embryos survived in the vehicle-treated group, but none of the 0.5 3 10−4 M and 1 3 10−4 M genistein-treated embryos survived, and about six embryos survived in the 0.25 3 10−4 M genistein-treated group [genistein concentration: (V) vehicle, (H) 1 3 10−4 M, (M) 0.5 3 10−4 M, (L) 0.25 3 10−4 M]. Data are expressed as mean ± SD. Values of each group with identical letters in each panel were not significantly different (p > 0.05).
![Figure 1. Developmental toxicity of genistein on zebrafish embryos. The zebrafish embryos at 24 h post-fertilization were exposed to genistein (1 3 10−4 M, 0.5 3 10−4 M, 0.25 3 10−4 M) or vehicle (ethanol, 0.1%) for 60 h. (A) Heart rates of genistein-treated embryos at 30 h after treatment decreased in dose-dependent manner. (B) Although about 90% of vehicle-treated embryos hatched at 37 h after treatment, genistein treatment decreased the number of hatched embryos. (C) Body lengths of genistein-treated embryos at 37 h after treatment decreased in a dose-dependent manner. (D) At 60 h after genistein treatment, all embryos survived in the vehicle-treated group, but none of the 0.5 3 10−4 M and 1 3 10−4 M genistein-treated embryos survived, and about six embryos survived in the 0.25 3 10−4 M genistein-treated group [genistein concentration: (V) vehicle, (H) 1 3 10−4 M, (M) 0.5 3 10−4 M, (L) 0.25 3 10−4 M]. Data are expressed as mean ± SD. Values of each group with identical letters in each panel were not significantly different (p > 0.05).](/cms/asset/9131ca19-0b30-4718-99e8-14f2de792762/itxm_a_356501_f0001_b.gif)
Figure 2. Developmental toxicity of genistein on zebrafish embryos. The zebrafish embryos at 24 h post-fertilization were exposed to genistein or vehicle for 60 h. (A) The body lengths of the genistein-treated embryos decreased in dose-dependent manner [genistein concentration: (V) vehicle, (L) 0.25 3 10−4 M, (M) 0.5 3 10−4 M]. (B, C) Malformations of embryos that survived after 0.25 3 10−4 M genistein treatment such as (1) pericardial edema, (2) yolk sac edema, and (3) spinal kyphosis. Bar = 1 mm.
![Figure 2. Developmental toxicity of genistein on zebrafish embryos. The zebrafish embryos at 24 h post-fertilization were exposed to genistein or vehicle for 60 h. (A) The body lengths of the genistein-treated embryos decreased in dose-dependent manner [genistein concentration: (V) vehicle, (L) 0.25 3 10−4 M, (M) 0.5 3 10−4 M]. (B, C) Malformations of embryos that survived after 0.25 3 10−4 M genistein treatment such as (1) pericardial edema, (2) yolk sac edema, and (3) spinal kyphosis. Bar = 1 mm.](/cms/asset/592091e4-a12d-4d41-b7d7-00a3ce7c0cd1/itxm_a_356501_f0002_b.gif)
Figure 3. Effect of isoproterenol in the presence of genistein on heart rate in zebrafish embryos. The zebrafish embryos at 24 h post-fertilization were exposed to isoproterenol (Vehicle, 1 3 10−6 M, 10 3 10−6 M, 100 3 10−6 M) in the presence of genistein (0.5 3 10−4 M). In the presence of genistein, isoproterenol (10 3 10−6 M, 100 3 10−6 M) increased heart rate significantly at 30 h after treatment. Data are expressed as mean ± SD. Values of each group with identical letters in each panel were not significantly different (p > 0.05).
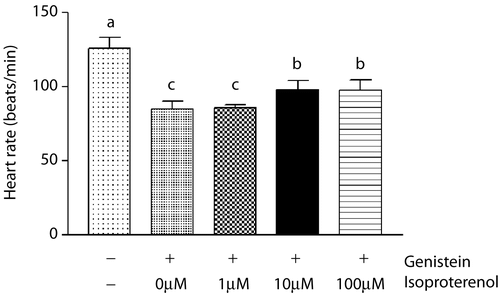
Figure 4. Histopathological examination. The zebrafish embryos at 24 h post-fertilization were exposed to genistein or vehicle for 60 h. The zebrafish embryos that survived after 0.25 3 10−4 M genistein or vehicle treatments were prepared for histopathological examination. Histopathological examination revealed that (arrows) granular degeneration of (B) myocytes in skeletal muscle in addition to (asterisks) loss and (arrow heads) apoptosis of (D) neural cells in the brain of the 0.25 3 10−4 M genistein-treated group. (A and C) vehicle-treated zebrafish embryos, (B and D) genistein-treated zebrafish embryos. Bar = 50 μm.
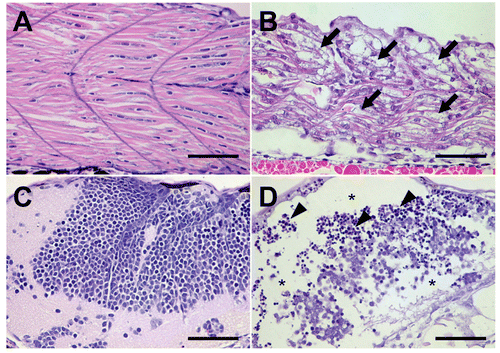
Figure 5. TUNEL assay. To determine whether neural cell damages were related to apoptosis, we conducted a TUNEL assay using the same tissue samples. TUNEL assay results showed apoptotic DNA fragments in (B and D) the brain and (C) spinal cord of 0.25 3 10−4 M genistein-treated zebrafish embryos. (A) vehicle treated zebrafish embryos, (B–D) genistein-treated zebrafish embryos. Bar = 50 μm.
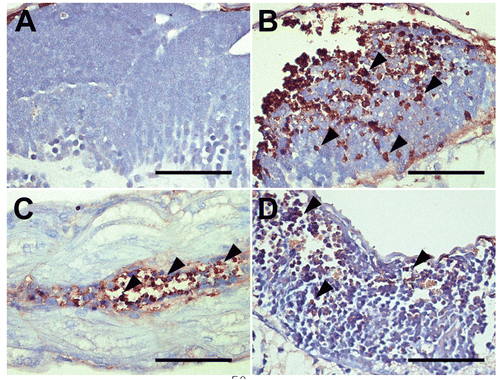
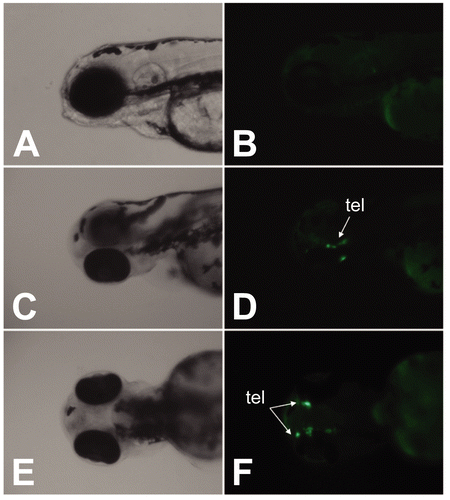
Figure 6. EGFP expression in response to genistein exposure. pzfAroB-EGFP injected embryos were exposed to genistein (10−6 M) at 2 hpf for 4 days. EGFP expression was localized in the telencephalon (tel) located in the forebrain. (A and B) vehicle-treated zebrafish embryos, (C–F) genistein-treated zebrafish embryos. (A, C, E: light microscope images, B, D, F: fluorescence microscope images).