
Figures & data
Figure 1. Borgwaldt RM20S smoking machine. (i) Cigarette smoke generator. (ii) Original four-syringe system. (iii) Four-syringe extension. (iv) Air-flow controller. (v) Cell culture media maintained at 37 °C. (vi) British American Tobacco’s exposure chamber housed at 37 °C, attached to the smoke diluter and culture media (modified from Adamson et al., Citation2011).
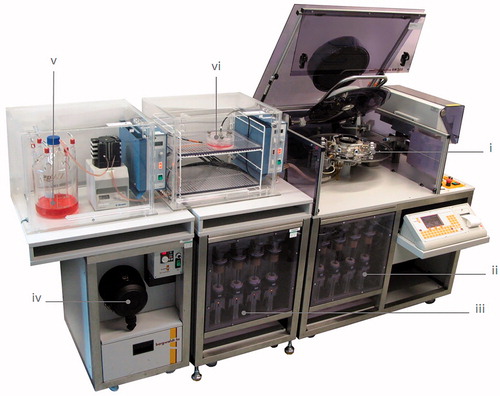
Figure 2. British American Tobacco’s standard exposure chamber used for in vitro exposures to aerosol at the air–liquid interface (a; Adamson et al., Citation2011 and b; Thorne & Adamson, Citation2013). Modifications to accommodate the three quartz crystal microbalance units (lid removed) (c; Adamson et al., Citation2013).
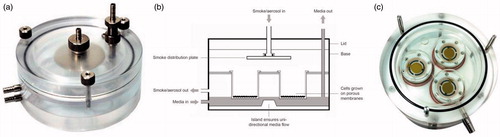
Figure 3. Vype ePen e-cigarettes are attached to the adapted Borgwaldt RM20S by bypassing the cigarette smoke generator.
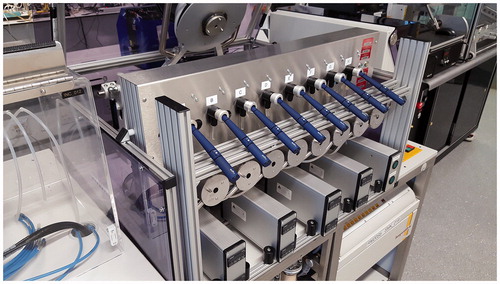
Table 1. Specification of products and parameters.
Table 2. Specification of Regimens and experimental parameters.
Figure 4. Deposited mass concentration of Vype eStick and Vype ePen e-cigarette aerosol generated over 15 minutes under two different regimens and various dilutions between 1:40 and 1:5 aerosol:air vol:vol, as quantified by quartz crystal microbalances within the in vitro exposure chamber. Data are represented as means and 95% confidence intervals of the fit, represented by the shaded region. Experiments were represented in the graphs by the individual points (n = 4 – 6 exposures per dilution). Abbreviations – HCI: Health Canada intense; ISO: International Organization for Standardization.
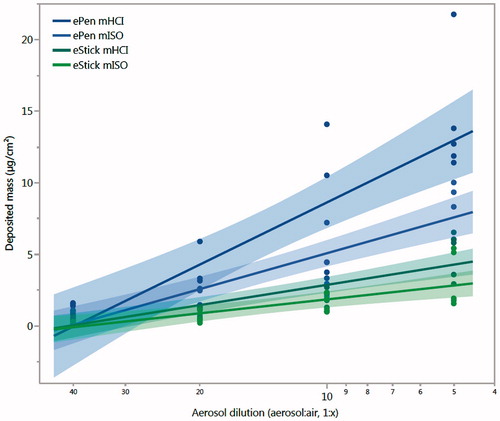
Table 3. Deposited eStick and ePen aerosol mass generated from a 15 minute exposure using modified ISO and HCI puffing regimens.
Figure 5. Estimated mass (a) and nicotine (b) deposition of Vype ePen e-cigarette aerosol and 3R4F reference cigarette smoke generated over 60 minutes under modified and standard HCI regimens and various dilutions between 1:100 – 1:2 aerosol:air, vol:vol and 1:2500 – 1:30 smoke:air, vol:vol, respectively, as quantified by quartz crystal microbalances within the in vitro exposure chamber. Experiments are represented by the individual points (n = 4–6). Abbreviation – HCI: Health Canada Intense.
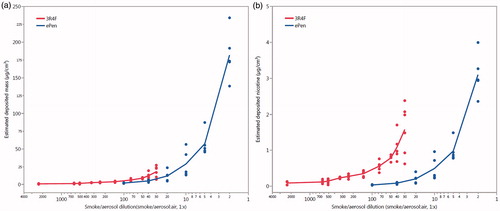
Table 4. Estimated deposited 3R4F and ePen smoke/aerosol and nicotine mass generated using the standard and modified HCI regimens respectively.
Figure 6. Changes in NCI-H292 cell viability (% of the air control) after exposure to various dilutions (Smoke/aerosol:air, vol:vol) of Vype ePen e-cigarette aerosol (n = 6 exposures per dilution) and 3R4F cigarette smoke (n = 8 exposures per dilution). Data are expressed according to (a) aerosol dilution (ePen EC50 = 1:5, 3R4F EC50 = 1:153 smoke/aerosol:air, vol:vol), (c) estimated deposited mass (ePen EC50 = 52.1, 3R4F EC50 = 3.1 μg/cm2) and (e) estimated deposited nicotine (ePen EC50 = 0.89, 3R4F EC50 = 0.27 μg/cm2). Data are represented as means (circles) and standard deviations (bars). Regression fit of the linear regions of Vype ePen e-cigarette (n = 6) and 3R4F cigarette aerosols (n = 8) NCI-H292 cell viability curves expressed according to (b) aerosol dilution, (d) estimated deposited mass and (f) estimated deposited nicotine. Data are represented as means and 95% confidence intervals of the fit, represented by the shaded region. Experiments are represented by the individual points.
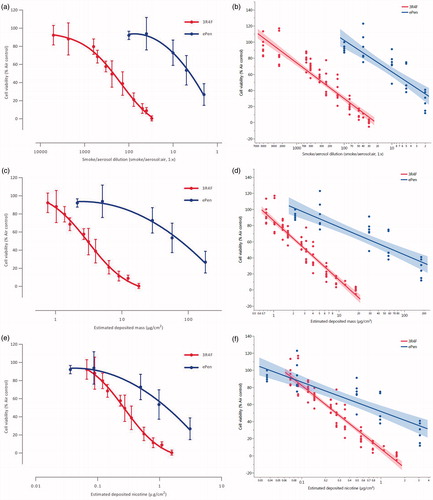
Table 5. 3R4F and ePen EC50 values expressed as smoke/aerosol dilution respectively, estimated deposited mass and estimated deposited nicotine.