Figures & data
Figure 1. Schematic of the chlorine gas exposure system. MFC: mass flow controller.
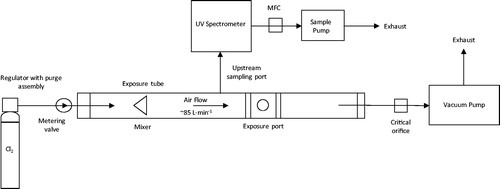
Table 1. Grades of epithelial injury scoring within trachea and bronchi.
Table 2. Grades of injury scoring within bronchioles.
Table 3. Grades of injury scoring within parenchyma, alveoli and interstitium.
Figure 2. (A) A representative example of an exposure profile of an animal exposed to chlorine, where an inhaled dose was targeted by titrating the chlorine concentration [Cl2] to the animal’s minute volume (Strategy 1). (B) A representative example of an exposure profile of an animal exposed to chlorine, where the exposure time was extended and chlorine concentration slowly increased (Strategy 2). (C) A representative example of an exposure profile of an animal exposed to chlorine, where the exposure time was short and chlorine concentration increased quickly (Strategy 3).
![Figure 2. (A) A representative example of an exposure profile of an animal exposed to chlorine, where an inhaled dose was targeted by titrating the chlorine concentration [Cl2] to the animal’s minute volume (Strategy 1). (B) A representative example of an exposure profile of an animal exposed to chlorine, where the exposure time was extended and chlorine concentration slowly increased (Strategy 2). (C) A representative example of an exposure profile of an animal exposed to chlorine, where the exposure time was short and chlorine concentration increased quickly (Strategy 3).](/cms/asset/2b401c89-519c-46f8-a255-b09832c9468e/itxm_a_1906808_f0002_b.jpg)
Table 4. Dosimetry metrics for Strategies 1, 2 and 3.
Table 5. Dosimetry metrics for low, medium and high inhaled dose groups.
Figure 3. Kaplan-Meier survival graph of air-exposed control animals and chlorine-exposed animals (n = 5/group). ID: inhaled dose.
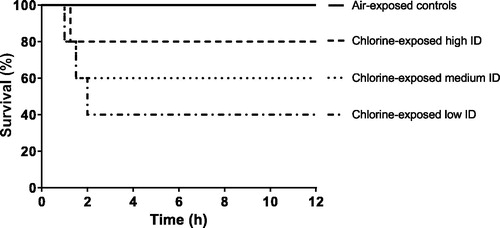
Figure 4. Changes in temperature adjusted PaO2 (A) and PaCO2 (B) in animals grouped as air-exposed controls, chlorine-exposed low ID, chlorine-exposed medium ID and chlorine-exposed high ID. * Significant linear trend (p < 0.05) between increasing doses of chlorine and the air controls. ‘d’ represents the death of an animal. Change in temperature adjusted arterial blood PaO2 (C) and PaCO2 (D) in animals grouped as air-exposed controls, chlorine survivors and chlorine non-survivors. Dashed line (- - -) displays a significant difference across 12 h between the chlorine-exposed survivors and the air-exposed controls. ** Percentage change from baseline AUC survivors vs air controls (p = 0.0049). Mean ± SD.
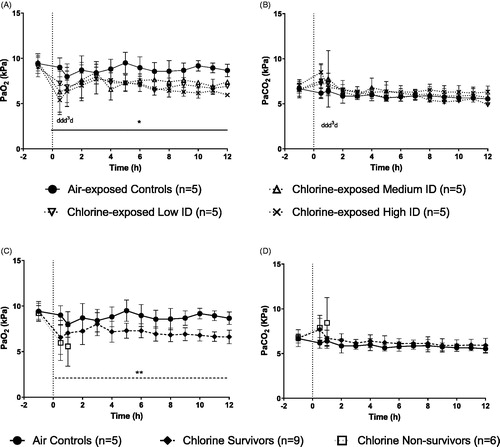
Table 6. Dosimetry metrics for survivors vs non-survivors.
Figure 5. Changes in temperature adjusted arterial blood lactate (A), pH (B), base excess (C) and bicarbonate (D). Mean ± SD.
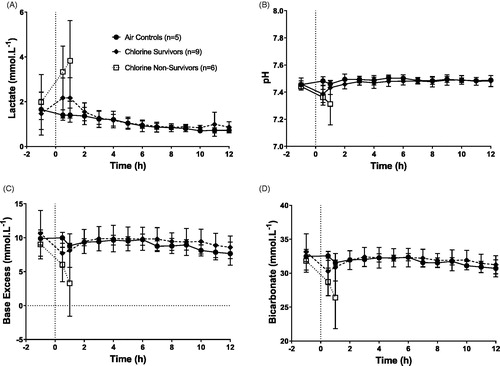
Figure 6. Changes in percentage shunt fraction. Dashed line (- - -) displays a significant difference across 12 h between the chlorine-exposed survivors and the air-exposed controls. Percentage change from baseline AUC survivors vs air controls (p = 0.049). Mean ± SD.
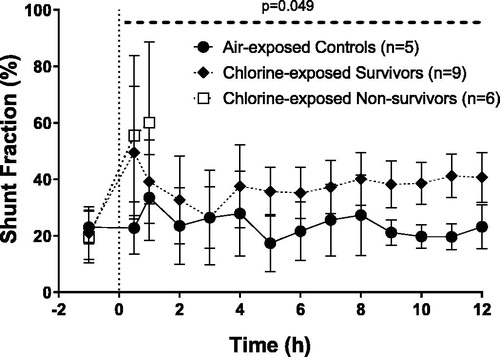
Figure 7. Differential WBC count analysis in terminal lavage fluid. The air-exposed control group for BAL fluid WBC counts were reduced to 3 animals due to lung abnormalities or difficulty collecting a full sample of BAL fluid at post mortem. * indicates significant difference for neutrophils (p = 0.02) and alveolar macrophages (p = 0.04) between the chlorine-exposed survivors when compared to air-exposed controls (Kruskal-Wallis One-Way ANOVA). Mean ± SD.
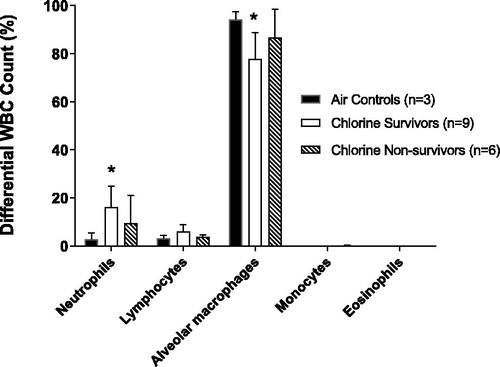
Figure 8. Hematoxylin and eosin stained sections (A) Air control, trachea, no injury (score 0), pseudostratified, ciliated, columnar epithelium with goblet cells. (B) Medium dose, trachea, moderate injury (score 2), erosion and degeneration of epithelium, edema, mixed inflammatory cell infiltration, and cellular debris, mucus, and erythrocytes in the lumen. (C) Air control, bronchiole, no injury (score 0). (D) Medium dose, bronchiole, moderate injury (score 2), erosion and degeneration of epithelium, mixed inflammatory cell infiltration, and sloughed epithelial cells, cellular debris, mucus and erythrocytes in the lumen. The surrounding parenchyma exhibits congestion, edema, fibrin exudation and polymorphonuclear cell infiltration. (E) Air control, lung parenchyma, no injury (score 0), (F) Medium dose, lung parenchyma, moderate injury (score 2), diffuse filling of alveolar spaces by eosinophilic fluid (edema) and fibrin strands, with congestion of alveolar capillaries and larger vessels, and numerous neutrophils within alveolar spaces and the interstitium.
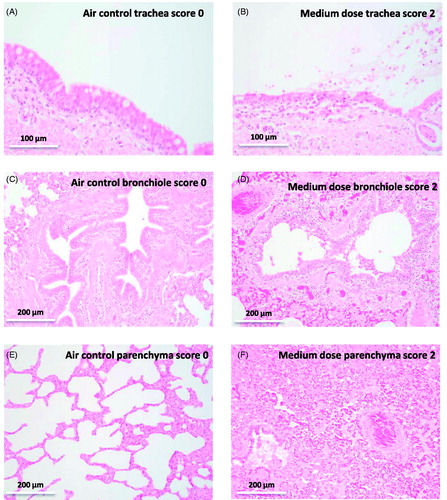
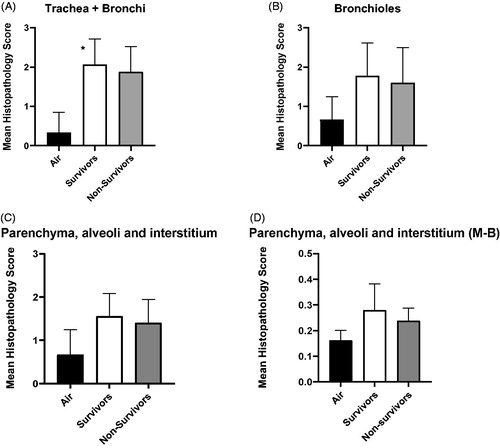
Figure 9. Mean histopathology score comparing air-exposed controls with animals surviving to 12 h along the length of the respiratory tract (A – trachea and bronchi; B – Bronchioles; C – Parenchyma, alveoli and interstitium; D - Parenchyma, alveoli and interstitium using scoring system of Matute-Bello et al., Citation2011 (M-B)). Air-exposed control = 3, chlorine-exposed survivors = 9, chlorine-exposed non-survivors = 5. * indicates significant difference between air-exposed controls and chlorine-exposed survivors (p < 0.0001, Tukey’s multiple comparison, one way ANOVA). Mean ± SD.