Figures & data
Figure 1. Cytotoxicity of tungstate and molybdate in HEK293 and HepG2 cells. Cells were treated with concentrations ranging from 0.1 μM to 10 mM of either tungstate (left panel) or molybdate (right panel) for 24 hours and cytotoxicity assessed with the MTT assay. The percentage of cell viability was calculated with regard to the untreated control at 100% cell viability. Each treatment group was compared with the corresponding control. * p < 0.01, statistically significant difference (n = 3).
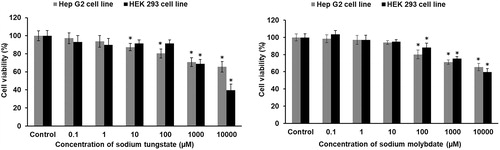
Figure 2. Tungstate and molybdate uptake in HEK293 and HepG2 cells. Cells were treated with concentrations ranging from 10 μM to 1 mM of either tungstate (left panel) or molybdate (right panel) for 24 hours and the cellular metal concentrations determined by ICP-MS. * p < 0.01, statistically significant difference (n = 3).
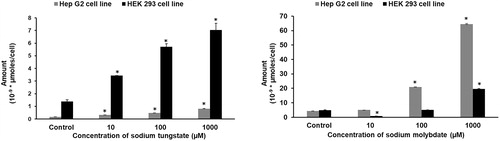
Figure 3. Tungstate and molybdate generate reactive oxygen species in HEK293 and HepG2 cells. Cells were treated with concentrations ranging from 10 μM to 1 mM of either tungstate (left panel) or molybdate (right panel) for one hour and ROS determined with DCFH-DA. * p < 0.01, statistically significant difference (n = 3).
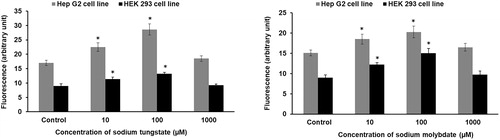
Figure 4. Tungstate and molybdate inhibit xanthine oxidase activity in HEK293 and HepG2 cells. Cells were treated with concentrations ranging from 10 μM to 1 mM of either tungstate (left panel) or molybdate (right panel) for one hour and xanthine oxidase assayed in cell lysates. The protein concentrations in the HepG2 and HEK293 lysates were 1.4 and 1.5 mg/ml, respectively. * p < 0.01, statistically significant difference (n = 3).
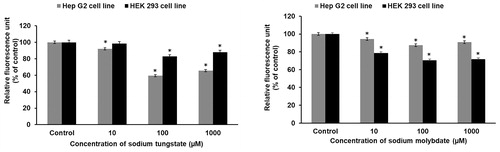
Figure 5. Effect of tungstate and molybdate on phosphatase activity in HEK293 and HepG2 cells. Cells were treated with concentrations ranging from 10 μM to 1 mM of either tungstate (left panel) or molybdate (right panel) for one hour and phosphatase activity determined in cell lysates. The protein concentrations in HEK293 and HepG2 lysates were 2.3 and 2.1 mg/ml, respectively, in the phosphatase assays. * p < 0.01, statistically significant difference (n = 3).
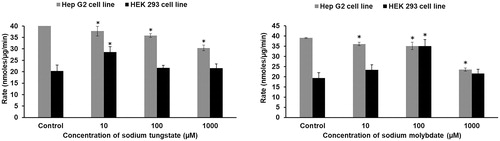
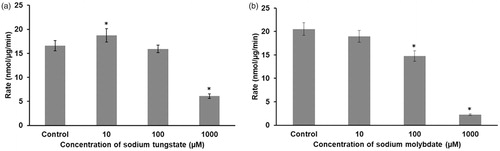
Figure 6. Tungstate or molybdate inhibit PTP-1B activity. The enzyme was incubated with concentrations ranging from 10 μM to 1 mM of either tungstate (a) or molybdate (b) and the enzymatic activity determined spectrofluorimetrically. The protein concentration was 2.5 nM and the substrate concentration was 3 µM. * p < 0.01, statistically significant difference (n = 3).