
Figures & data
Figure 1. Volcano plots of differentially expressed genes (DEGs). (A) DQ vs. CON and (B) PQ vs. CON. Gray, non-differentially expressed genes; red, significantly upregulated genes; blue, significantly downregulated genes (based on a fold change ≤ -2 or ≥ 2 and a p. value ≤ 0.05). FC, fold change.
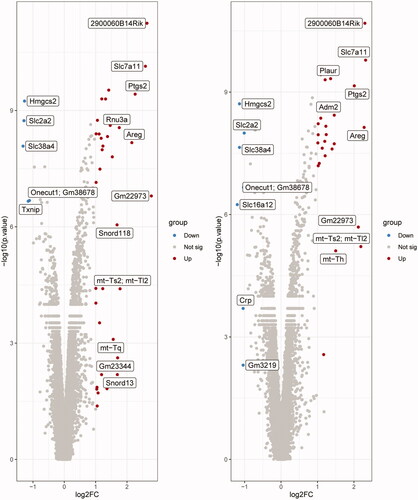
Figure 2. (A) Venn diagram of intersecting DEGs. (B) Heat map of intersecting DEGs.
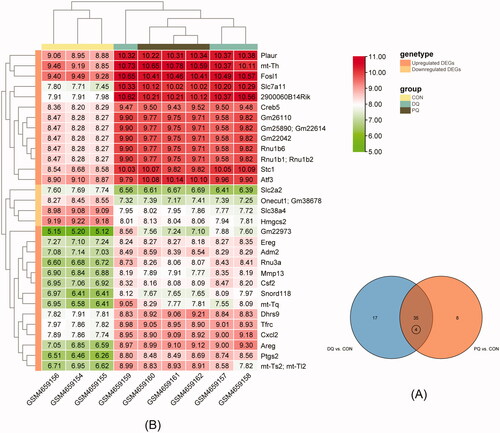
Figure 3. GO and KEGG enrichment analysis of intersecting DEGs (top 10 hub genes, enriched terms ≥ 2 genes and a p. value ≤ 0.1). (A) GO analysis: Biological Process (BP) (green points), Cellular Component (CC) (red points), and Molecular Function (MF) (purple points). (B) KEGG pathways (green points). Point size indicates the p. value of each point.
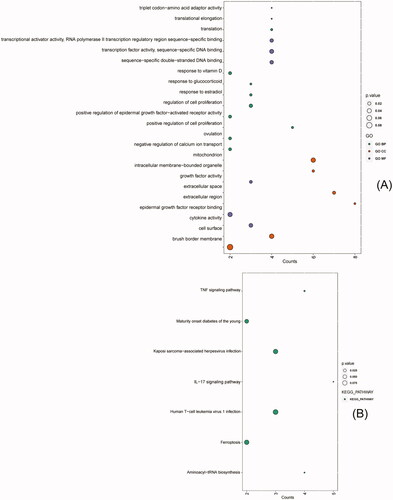
Figure 4. PPI network of the intersecting of DEGs. Red, upregulated genes; green, downregulated genes. Node size was positively related to the source node attribute, edge color and width were positively related to the combined score.
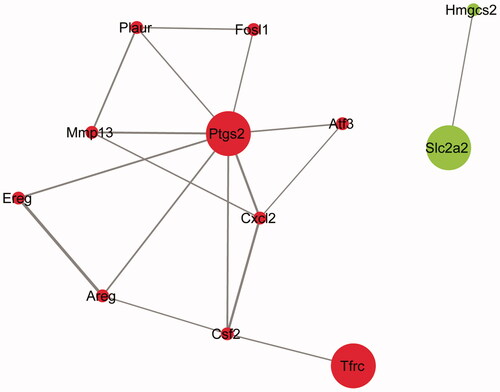
Figure 5. Distribution of genes on chromosomes. (A) Circos plot: distribution of genes on mouse chromosomes. Gene symbol-number corresponds to different transcripts. Gray lines, collinearity of all mouse chromosomes; colored lines, collinearity of chromosomes of the 12 mouse genes. (B) Contrast plot of mouse and human genes: comparative distribution of the genes on the mouse and human chromosomes. Gray lines, collinearity of all mouse and human genes; red lines, collinearity of 11 mouse and human genes; orange bars, mouse chromosomes; green bars, human chromosomes.
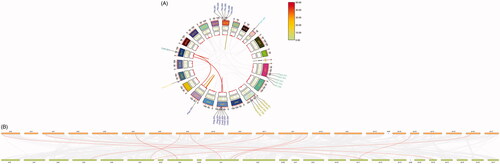
Table 1. Comparative distribution of genes on mouse and human chromosomes.