
Figures & data
Figure 1. Identification of expressed UGT1A proteins using western blotting, maximum velocity of each wildtype UGT1A protein (A), and Michaelis–Menten kinetics of SN-38 glucuronidation by the expression of each wildtype UGT1A protein (B). (A) The relative expression levels of each of the UGT1A protein were determined using western blotting with mouse anti-human UGT1A antibody and m-IgG k BP-HRP. Approximately 55-kDa protein bands were detected in all expression models and UGT1A-positive proteins. The columns indicate the maximum velocity of each wildtype of UGT1A protein for SN-38 glucuronidation. The reaction mixture contained 15 μL cell homogenate and 2 mM UDPGA; it was incubated at 37 °C for 1 h at pH 7.4. SN-38 concentrations ranged from 0.1 to 2.0 mM. (B) The line indicates the fitting of the data to the Michaelis–Menten equation using non-linear regression. The reaction mixture contained 15 μL cell homogenate and 2 mM UDPGA; it was incubated at 37 °C for 1 h at pH 7.4. SN-38 concentrations ranged from 0.1 to 2.0 mM. PC: positive control; †p < 0.05 compared with wildtype UGT1A1.
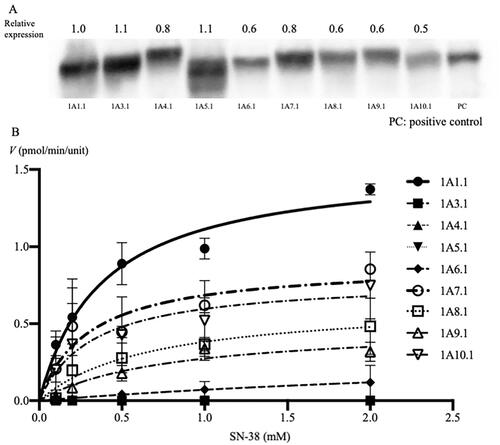
Figure 2. Identification of the expression of each of the UGT1A protein (wildtype and major variant proteins) using western blotting and Michaelis–Menten kinetics of SN-38 glucuronidation, expressed by each wildtype and major variants of UGT1A proteins. The relative expression levels of each of the UGT1A protein were determined using western blotting with mouse anti-human UGT1A antibody and m-IgG k BP-HRP. Approximately 55-kDa protein bands were detected in all wildtype and polymorphic UGT1A proteins. The line indicates the fitting of the data to the Michaelis–Menten equation using non-linear regression. The reaction mixture contained 15 μL cell homogenate and 2 mM UDPGA; it was incubated at 37 °C for 1 h at pH 7.4. SN-38 concentrations ranged from 0.1 to 2.0 mM.
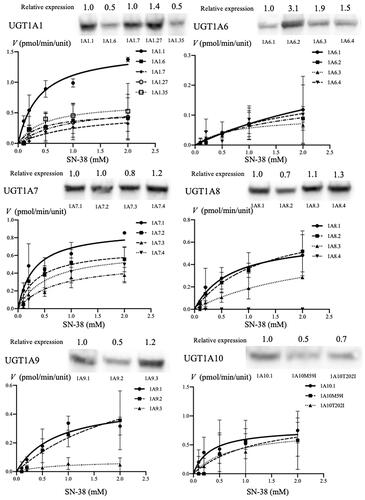
Table 1. Catalytic activity of each UGT1A.1 isoform.
Table 2. Catalytic activity of each UGT1A variant.
Supplemental Material
Download MS Word (18.3 KB)Supplemental Material
Download JPEG Image (62.4 KB)
Data availability statement
The data that support the findings of this study are available from the corresponding author, Y. M., upon reasonable request.