
Figures & data
Figure 1. Viability of liver spheroids with clozapine and metabolism of clozapine. (A) Dose-dependent effect of clozapine on liver spheroid viability. The adenosine triphosphate content values were normalized with the values obtained in untreated spheroids (100%). Each dot corresponds to the mean ± standard deviation (n = 8). Two-way analysis of variance with Dunnett’s post comparison vs. untreated **** (p < 0.0001). (B) Metabolites resulting from clozapine metabolization. The structure of the seven metabolites (M1–M7; M6, norclozapine; M2, clozapine N-oxide) predicted after incubation of liver spheroids with clozapine. (C) Proportion of clozapine metabolites. Each bar corresponds to the mean ± standard error of the mean (n = 12).
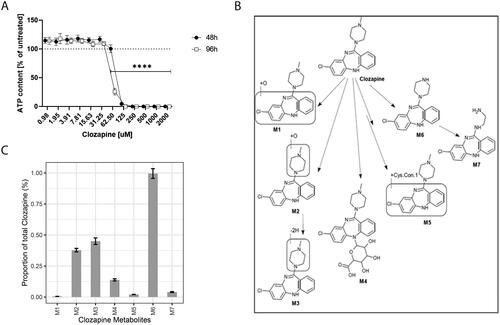
Figure 2. Clozapine’s effect on the liver spheroid proteome. (A) Volcano plot showing the log2 fold-change (x-axis) and statistical significance (−log10 FDR adjusted p value, y-axis). Significantly differentially expressed proteins (FDR adjusted p value < 0.05, n = 3) are indicated with larger dots. (B) Comparison of the proteome response to TNFα + IL-1β versus 60 µM clozapine treatment. Fold-change responses of differentially expressed proteins upon TNFα + IL-1β treatment are compared. (C) Gene-set enrichment results for 60 µM clozapine treatment. See Supplementary Table 2 for more details. (D) Autophagy-related protein cluster. All included proteins were upregulated. See Supplementary Figure 3 for more details. (E) Protein expression profiles of differentially expressed proteins upon 60 µM clozapine exposure. Autophagy-related proteins are highlighted in bold.
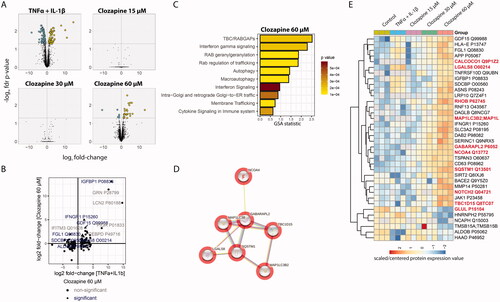
Figure 3. Clozapine’s effect on cytokine secretion. Cytokine secretion was quantified by Luminex technology. Analytes quantified above the limit of quantification were selected for this figure. T-test versus untreated were evaluated (ns, non-significant; *p < 0.05; **p < 0.01; ***p < 0.001; ****p < 0.0001). See Supplementary Figure 1 for the whole cytokine panel.
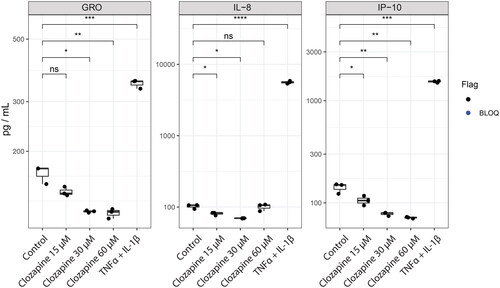
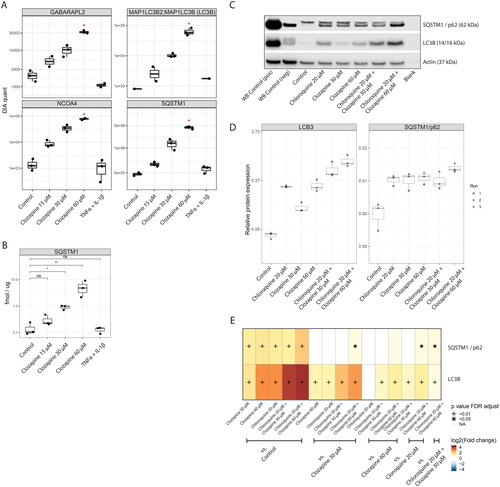
Figure 4. Clozapine induces autophagy in liver spheroid cultures. (A) Quantification of autophagy markers by data-independent acquisition. See Supplementary Figure 4 for additional autophagy-related proteins. (B) Confirmation of sequestosome-1 (SQSTM1) induction upon clozapine exposure, measured by the targeted proteomics approach. (C) Western blots of SQSTM1 and LCB3I/II, including Clozapine and Chloroquine combination treatments. (D) Boxplot of the quantification of western blot results. (E) Heatmap summarizing the results of the statistical comparisons for the western blots (panels C and D). Log2 fold-changes of the indicated comparisons are color coded and statistical significance is marked (+, FDR adjusted p value < 0.01; *, FDR adjusted p value < 0.05; n = 3).
Supplemental Material
Download PDF (176.6 KB)Supplemental Material
Download PDF (613.6 KB)Supplemental Material
Download PDF (7.8 MB)Supplemental Material
Download PDF (144.4 KB)Supplemental Material
Download MS Excel (30.1 KB)Supplemental Material
Download MS Excel (23.4 KB)Data availability statement
The mass spectrometry proteomic data are available from the ProteomeXchange Consortium through the PRIDE partner repository (http://www.ebi.ac.uk/pride/archive/) (Perez-Riverol et al. Citation2019), with the identifier PXD034257and PXD038007.