
Figures & data
Figure 1. Multi-Omics Factor Analysis (MOFA) model overview. MOFA takes proteomic, phosphoproteomic and transcriptomic data matrices (Y1, Y2, Y3) as input and decomposes these matrices into factor matrices Z1, Z2, Z3 and weight matrices W1, W2, and W3 for each data input.The green dataset represents proteomic data. The blue dataset is indicative of phosphoproteomic data. The yellow dataset corresponds to transcriptomic data. Within the Y matrices, any white elements highlight the presence of missing values. As for the weight matrices, the variation in color intensity–from light to dark shades–symbolizes the range of weights corresponding to different numerical values. Similarly, in the factor matrices, the gradation of color represents varying weights associated with distinct numerical values.
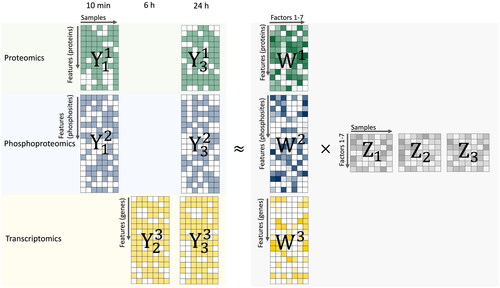
Figure 2. PCA of (a) transcriptome, (b) proteome, and (c) phosphoproteome; the number of differentially expressed (d) genes, (e) proteins, and (f) phosphosites.
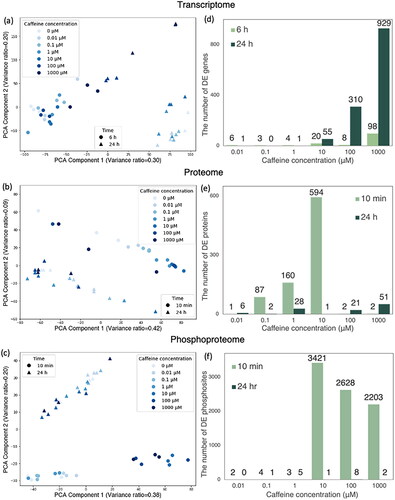
Figure 3. (a) Total variance explained for all factors across different time points and omics layer; (b) percentage of variance explained for each factor across different time points and omics layer. Factor 1 captures a strong source of variation from 24 h. Factor 2 primarily encapsulates variation evident in the phosphoproteomics at the 10-min mark and in transcriptomics at 6 h. Factor 3 represents distinct variance in proteome in response to a perturbation at 10 min. Factor 4 captures the variance specific to transcriptomic data. Factor 5 captures variation from transcriptomic data observed at 6 h. Factor 6 captures variation from 10 min. Factor 7 captures weak variation across transcriptomic and proteomic data.
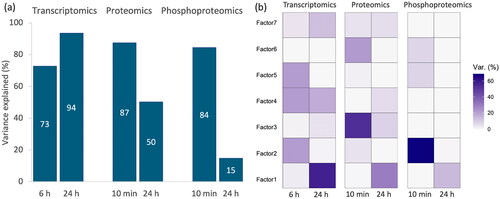
Figure 4. Factor value of Factor 1–6 at three time points and seven doses of caffeine (a–f). Factor values indicated the relative alteration level. Six factors exhibit clear time and dose-dependent trends.
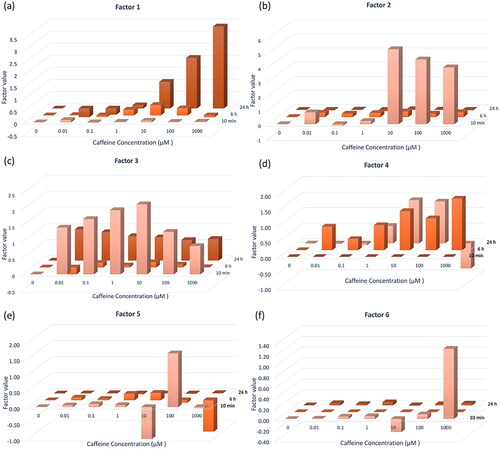
Figure 5. Part of enriched Reactome pathways result. While the outer ring showcases all significant second-level pathways (p-values < 0.05), the inner ring displays the parent pathways. Color intensity in the rings indicates the p-value. (a) Factor 1 regulates several metabolism pathways, neuronal systems etc.; (b) Factor 2 regulates signaling by nuclear receptors, protein–protein interactions at synapses and the citric acid (TCA) cycle and respiratory electron transport, etc.; (c) Factor 3 regulates DNA replication, cell cycle, cellular response to stimuli, autophagy, signal transduction, etc; (d) Factor 4 is related to transport of small molecules, Organelle biogenesis and maintenance and Sensory Perception etc.; (e) Factor 6 relates to cell cycle, programmed cell death, etc.
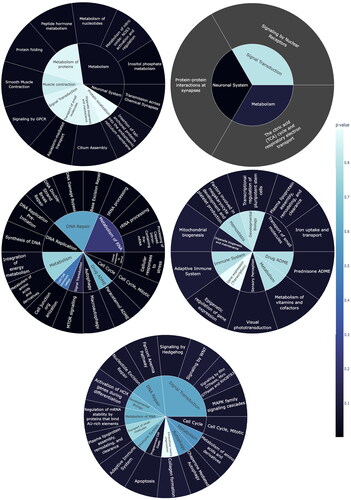
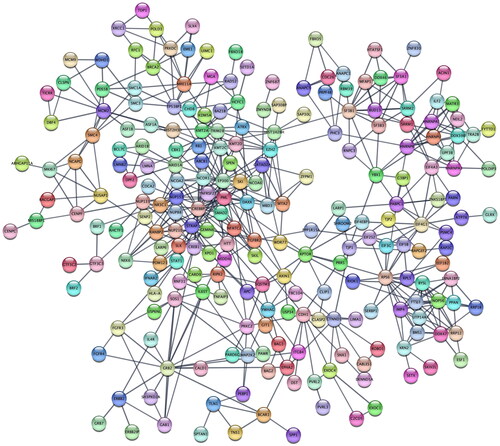
Figure 6. Protein–protein interaction network reconstructed from phosphoproteins that are highly related to factor 1.
KSEA Kinase Scores
Download MS Excel (25 KB)PPI Factor
Download MS Excel (367.7 KB)STRING PPI Results
Download MS Excel (689.4 KB)Reactome pathway analysis results
Download MS Excel (189.2 KB)Phosphoproteomics Factor
Download MS Excel (138 KB)Proteomics Factor
Download MS Excel (38.6 KB)Transcriptomics Factor
Download MS Excel (106.2 KB)Differentially expressed proteins
Download MS Excel (28.3 KB)Differential expressed phosphosites
Download MS Excel (121.7 KB)Defferential expressed genes
Download MS Excel (34.5 KB)Supplemental Material
Download MS Word (16.5 KB)Data availability statement
The authors confirm that the data supporting the findings of this study are available within the article and its supplementary materials. The data and code that support the findings of this study are available from the following GitHub repository https://github.com/Yufan98/multi-variate-multi-omics-data-analysis. Raw data are available from the Gene Expression Omnibus website (https://www.ncbi.nlm.nih.gov/geo/) with the accession numbers GSE200441 and GSE200700 and ProteomeXchange Consortium website (http://proteomecentral.proteomexchange.org) with the dataset identifier PXD030943, PXD030946, PXD031031, PXD031005.