
Figures & data
Figure 1. Overview of the experimental work. Low-energy WAFs (LE-WAFs) of the MASS oil, as well as the CTC and Juniper residues were subject to extraction and isolation of the polar fraction. Both extract and polar fraction were re-constituted in seawater (RE-WAF, RE-POL). The resulting solutions (WAF, RE-WAF, and RE-POL) were subject to toxicity tests and chemical analysis.
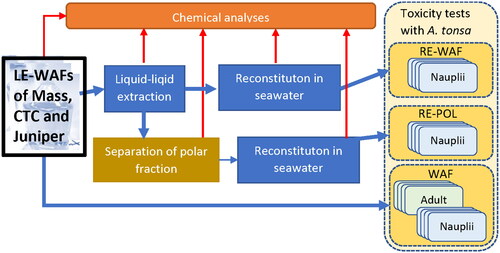
Figure 2. GC-MS target analytes quantified in WAFs from MASS, CTC and Juniper oils and their corresponding polar fractions. Please note the differences in scale between the figures. Abbreviations are explained in Supporting Information SI3, Table S3.
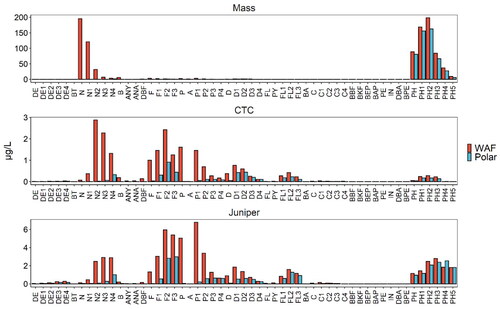
Figure 3. ESI- TOF mass spectra of WAFs from the MASS oil (A) and the field weathered oils CTC (B) and Juniper (C). The spectra show the increased complexity in chemical composition of the oil after weathering. More features with higher m/z ratios are observed. The Venn diagrams of distinct features counted in the binned spectra also show this trend for both positive (D) and negative mode (E) spectra. More distinct features are present in the WAFs from the weathered oils than in the source oil.
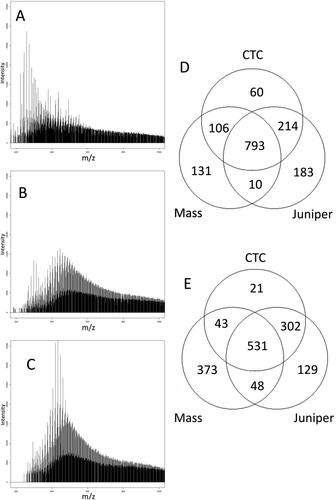
Figure 4. Survival relative to controls of Acartia tonsa nauplii exposed for 48 h to original WAF (oil to water ratio 1: 100) and reconstituted extracts, RE-WAF and RE-POL. A) CTC, WAF, reconstituted WAF (RE-WAF) and polar fraction (RE-POL). Data for RE-WAF and RE-POL are piled from three replicate tests each with 4 parallels (N = 12), N = 4 for WAF-test. B) Juniper, WAF, reconstituted WAF (RE-WAF) and polar fraction (RE-POL). N = 4 for all points. The standard deviation (whiskers) and 95% confidence interval (dotted line) are indicated.
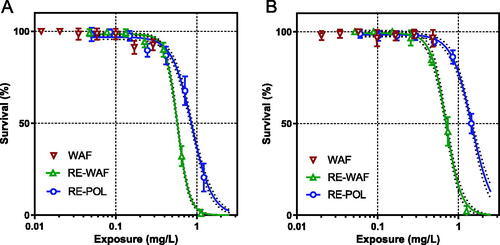
Figure 5. Toxicity contribution from identified and unresolved material in WAFs of fresh and field-weathered Deepwater Horizon oil samples. (A) Calculated TU based on resolved material in WAFs (OWR 1:100) of fresh and field weathered oils. (B) TU contribution of resolved material compared to recorded toxicity in up concentrated and reconstituted WAFs and polar fractions of field weathered oils. The TU contribution of the UPC fraction represents the difference between theoretical and actual toxicity.
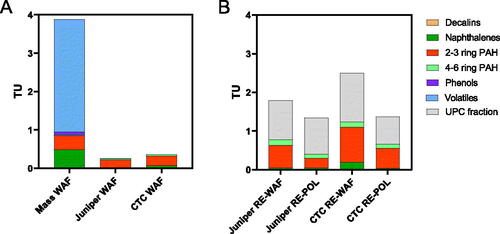
Table 1. Summary of contribution of identified compounds (ID) and unresolved polar compounds (UPC) to GC-amenable in the extract and to the toxicity of the extracts, including LC50 of the different groups and combinations. NA: no analyses due to too low toxicity in WAFs.