
Figures & data
Table 1. Inclusion and exclusion criteria.
Table 2. Assessment of risk of bias and quality of included studies by CASP tool (Long et al., Citation2020).
Figure 1. PRISMA flowchart for the selection process (Page et al., Citation2021).
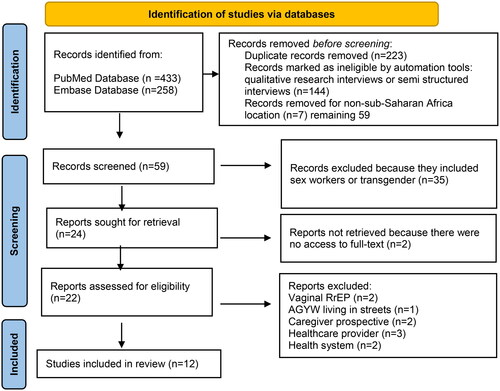
Table 3. Findings related to challenges to PrEP use in AGYW in Sub-Saharan Africa.