1,135
Views
9
CrossRef citations to date
0
Altmetric
Research Paper

Time-dependent pretreatment with bevacuzimab increases tumor specific uptake of cetuximab in preclinical oral cavity cancer studies

, , , &
Pages 790-798 | Received 04 Nov 2014, Accepted 03 Feb 2015, Published online: 29 Apr 2015

Figures & data

Figure 1. Imaging and Quantification of OSC-19 Orthotopic Model. (A) Imaging on Day 2 of the tongue using SPY (left) and Pearl (right). (B) Quantification of Tumor-to-Background Ratio (TBR) with mean ± SD plotted. (C) Immunohistochemistry and H&E stains demonstrating EGFR, HER2, and VEGF distributions in representative tumors.
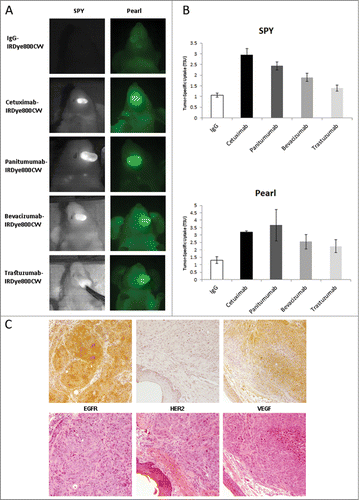
Figure 1. Imaging and Quantification of OSC-19 Orthotopic Model. (A) Imaging on Day 2 of the tongue using SPY (left) and Pearl (right). (B) Quantification of Tumor-to-Background Ratio (TBR) with mean ± SD plotted. (C) Immunohistochemistry and H&E stains demonstrating EGFR, HER2, and VEGF distributions in representative tumors.

Figure 2. Quantification and Representative Images of OSC-19 Flank Model. (A) Daily imaging TSU values for all 5 treatment groups with mean ± SD plotted. (B) Representative images for all 5 treatment groups for Day 3, 7 and 14. Exposure times and aperture settings are equivalent for all images.
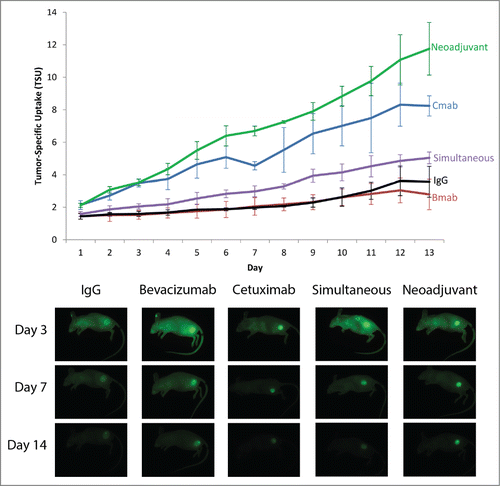
Figure 2. Quantification and Representative Images of OSC-19 Flank Model. (A) Daily imaging TSU values for all 5 treatment groups with mean ± SD plotted. (B) Representative images for all 5 treatment groups for Day 3, 7 and 14. Exposure times and aperture settings are equivalent for all images.

Figure 3. Tumor, Background and TSU values of OSC-19 and SCC-1 Flank Model.Daily tumor (blue), background (red), and TSU (green line) plotted with mean ± SD. (A) Cetuximab group, OSC-19 cell line (B) Neoadjuvant group, OSC-19 cell line (C) Cetuximab group, SCC-1 cell line (D) Neoadjuvant group, SCC-1 cell line.
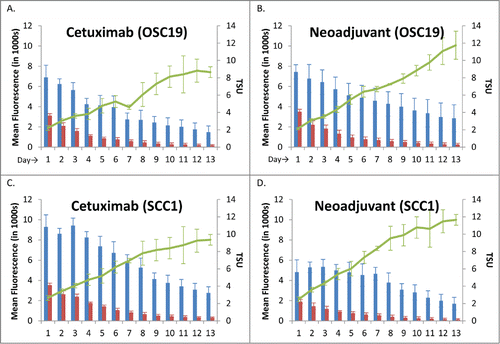
Figure 3. Tumor, Background and TSU values of OSC-19 and SCC-1 Flank Model.Daily tumor (blue), background (red), and TSU (green line) plotted with mean ± SD. (A) Cetuximab group, OSC-19 cell line (B) Neoadjuvant group, OSC-19 cell line (C) Cetuximab group, SCC-1 cell line (D) Neoadjuvant group, SCC-1 cell line.

Figure 4. Vascular normalization by histology>(A) Tumors from the Cetuximab Only and Neoadjuvant groups were stained with CD31 (top, vascular endothelium) and NG2 (bottom, pericyte) to examine pericyte coverage. Magnification: 200×. (B) Areas of colocalized CD31 and NG2 were calculated with ImageJ and reported as a mean ratio of pericyte coverage. Error bars represent SD.
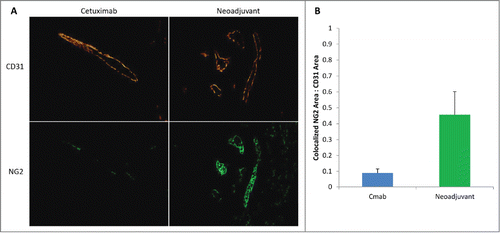
Figure 4. Vascular normalization by histology>(A) Tumors from the Cetuximab Only and Neoadjuvant groups were stained with CD31 (top, vascular endothelium) and NG2 (bottom, pericyte) to examine pericyte coverage. Magnification: 200×. (B) Areas of colocalized CD31 and NG2 were calculated with ImageJ and reported as a mean ratio of pericyte coverage. Error bars represent SD.

Figure 5. Therapeutic Effect of Vessel Normalization: Percent Change in Tumor Volume & Cellular Proliferation. (A) Tumor volume was assessed by caliper measurements and the mean percent volume change was compared between Day 0 and Day 14. Error bars represent SD. (B) Tumors from the Cetuximab Only and Neoadjuvant groups were stained with Ki67 (top, cellular proliferation) and DAPI (bottom, nucleus) to examine treatment effect of cetuximab. Magnification: 100×.
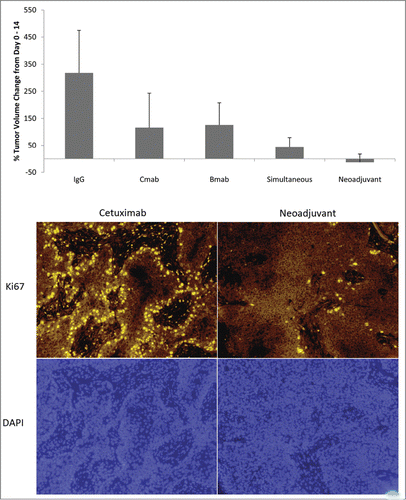
Figure 5. Therapeutic Effect of Vessel Normalization: Percent Change in Tumor Volume & Cellular Proliferation. (A) Tumor volume was assessed by caliper measurements and the mean percent volume change was compared between Day 0 and Day 14. Error bars represent SD. (B) Tumors from the Cetuximab Only and Neoadjuvant groups were stained with Ki67 (top, cellular proliferation) and DAPI (bottom, nucleus) to examine treatment effect of cetuximab. Magnification: 100×.

Figure 6. Specificity of Dye Uptake Using FDA-Approved Open-Field Fluorescence Imaging.Representative images demonstrating tumors with skin flaps elevated to simulate a surgical field where the bright field image (left) demonstrates tumor location and the near-infrared fluorescence with the LUNA system(right) illustrates the specificity of cetuximab-IRDye800 to the tumor. Exposure time (1 second) and aperture are equivalent for all images.
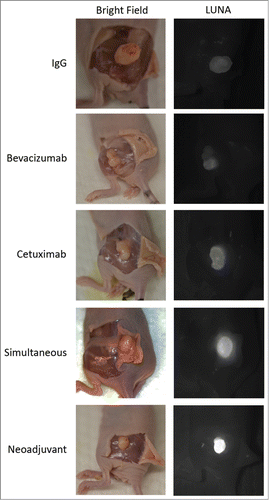
Figure 6. Specificity of Dye Uptake Using FDA-Approved Open-Field Fluorescence Imaging.Representative images demonstrating tumors with skin flaps elevated to simulate a surgical field where the bright field image (left) demonstrates tumor location and the near-infrared fluorescence with the LUNA system(right) illustrates the specificity of cetuximab-IRDye800 to the tumor. Exposure time (1 second) and aperture are equivalent for all images.

Reprints and Corporate Permissions

Please note: Selecting permissions does not provide access to the full text of the article, please see our help page How do I view content?

To request a reprint or corporate permissions for this article, please click on the relevant link below:

Academic Permissions

Please note: Selecting permissions does not provide access to the full text of the article, please see our help page How do I view content?

Obtain permissions instantly via Rightslink by clicking on the button below:

If you are unable to obtain permissions via Rightslink, please complete and submit this Permissions form. For more information, please visit our Permissions help page.