Figures & data
Figure 1. (A) Binding of anti-OFA/iLRP antibodies to 12-amino acid peptides from OFA/iLRP. The overlapping 12-AA sequences are shown at left and antibody reactivity by ELISA is shown in the bar graphs to the right. (B) Interaction of anti-OFA/iLRP monoclonal antibodies with cells by confocal fluorescence microscopy. Top row: HCC38 triple-negative human breast carcinoma; Middle row: human epidermal keratinocytes; Bottom row: human dermal fibroblasts. Cells were fixed in 2% paraformaldehyde but not permeabilized prior to addition of the primary antibody. (C) Interaction of anti-OFA/iLRP monoclonal antibodies with cell lysates by protein gel blotting (lower panels). In each panel: Lane a: K562; Lane b: HL60; Lane c: HCC38 Breast carcinoma; Lane d: Normal fibroblasts; Lane e: Normal keratinocytes; Lane f: Immortalized keratinocytes (HaCat).
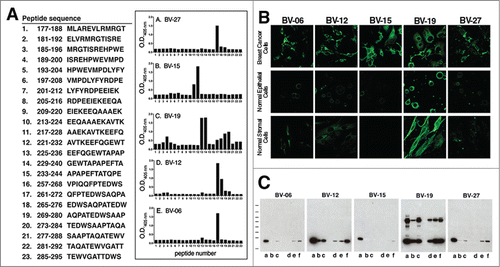
Table 1. Affinity values of 5 anti-OFA/iLRP monoclonal antibodies
Figure 2. Effects of anti-OFA/iLRP antibodies on Primary A20 tumor growth. Syngeneic BALB/c mice were treated with monoclonal antibody BV-15 vs. IgG2a (n = 15 and n = 12, respectively) and BV-27 versus IgG2a (n = 15 and n = 14, respectively). Values are tumor volume means and standard deviations based on diameter measurements in 2 dimensions. Asterisks denote significance from control at the P < 0.05 level, based on Student t-test. Insert. Histological features of A20 tumor in syngeneic BALB/c mice treated with control IgG2a or BV-27. No significant difference in tumor appearance is noted (Hematoxylin and eosin – stained sections, magnification 66x).
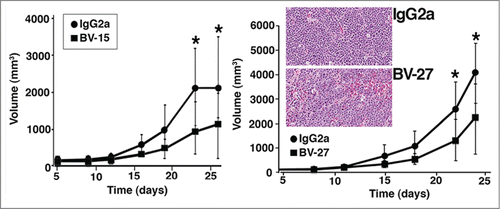
Figure 3. Effects of anti-OFA/iLRP antibodies on A20 tumor growth following intravenous tumor cell injection. (A) Liver tumor formation in BALB/c mice injected with A20 cells by the intravenous route and treated with BV-15 vs. IgG2a (n = 15 and n = 14, respectively) and BV-27 versus IgG2a (n = 13 and n = 12, respectively). Values shown are means and standard deviations. Asterisks denote significance from control at the P < 0.05 level based on Student t-test. Insert. Histological and immuno-histological features of liver tumors in BALB/c mice treated with IgG2a or BV-27. Upper panels; Hematoxylin and eosin stained: Tumors are well-defined nodules surrounded by normal liver tissue (arrows). Middle panels: T-cell infiltrate: Tumors from both groups demonstrate infiltrating T-cells in comparable numbers. Lower panels: Macrophages/dendritic cells: These cells are present in liver tissue from both groups, mostly confined to the border between the tumor and the normal tissue surrounding the tumor (arrows). Magnification: Upper panels and lower panels, 66x; middle panels, 130x. (B) Blood tumor levels in BALB/c mice treated with BV-15 (n = 15) and BV-27 (n = 13) vs. IgG2a (n = 55) animals per group. Bars represent the percentage of mice in each group with the blood tumor level shown on the x-axis. Therapeutic antibody and control IgG2a were compared by the Fisher Exact Test for statistical significance. Results with both therapeutic antibodies were statistically different from control at P < 0.001.
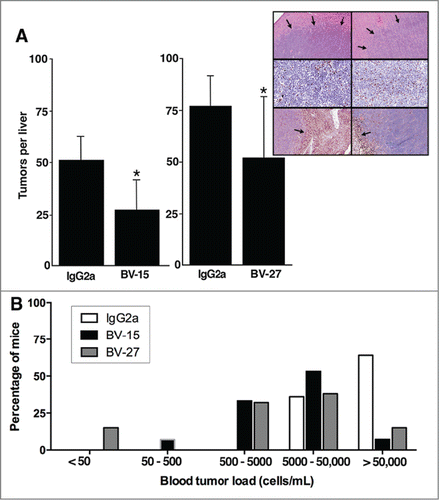
Figure 4. Effects of anti-OFA/iLRP antibodies on A20 cells in vitro. (A) In vitro growth of A20 cells: Effects of BV-15 and BV-27 versus IgG2a. Values shown are means and standard errors (percent inhibition of growth) based on n = 4 separate studies with duplicate samples per data point. Asterisks denote significance from control at P < 0.05, determined by ANOVA followed by paired group comparisons. (B) Attachment to laminin and fibronectin. Values shown are means and standard errors (percent inhibition of attachment). Laminin data are based on n = 5 separate experiments with duplicate samples per data point. Results with fibronectin are based on n = 4 experiments with duplicate samples per data point. Asterisks indicate statistical difference from control at P < 0.05 based on ANOVA followed by paired group comparison.
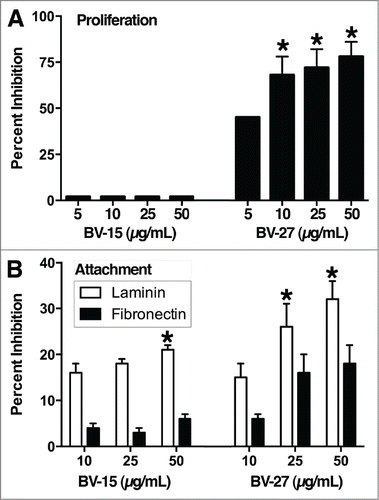
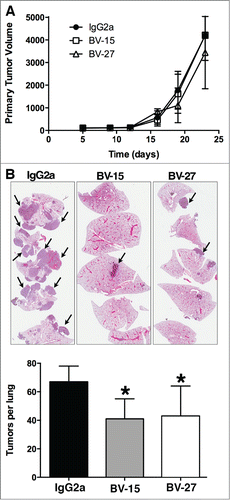
Figure 5. Effects of anti-OFA/iLRP antibodies on B16 melanoma tumor growth in vivo. (A) Primary B16 melanoma tumor volume in syngeneic C57BL/6 mice treated with monoclonal antibody BV-15 and BV-27 vs. IgG2a (n = 9, n = 10 and n = 9 mice, respectively). Values are tumor volume means and standard deviations based on diameter measurements in 2 dimensions. (B) Lung tumor formation in C57BL/6 mice injected with B16 melanoma cells by the intravenous route and treated with BV-15 and BV27 versus IgG2a (n = 15, n = 14 and n = 13 mice, respectively). Values shown are means and standard deviations. Asterisks denote significance from control at the P < 0.05 level, based on ANOVA followed by paired-group comparisons. Insert: Hematoxylin and eosin stained lung tissue: Tumors were well-defined nodules on the lung surface or within the parenchyma (arrows) (Magnification, 66x).