
Figures & data
Table 1. Blood draw protocol for patients on FOLFOX/FOLFIRI regimes. Blood can be drawn upto 7 times during the course of chemotherapy.
Table 2. Blood draw protocol for patients on XELODA (capecitabine)-based chemotherapy.
Figure 1. A (H&E) and 1B (EpCAM). Primary tumor of a case with baseline CTC of 56.33 ± 7 .06. (H&E) and 1D (EpCAM). Metastatic tumor of a different case with baseline CTC of 0.
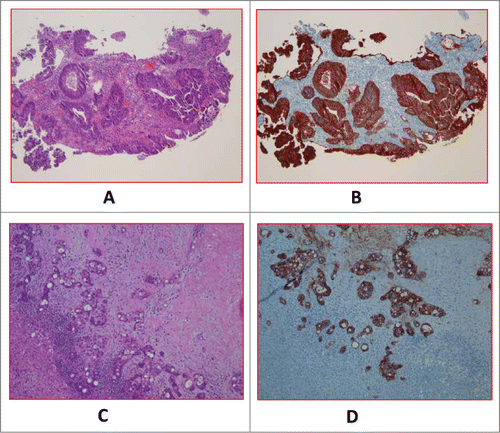
Figure 2. The burden of metastatic disease in the liver does not correlate with CTC count as determined by the CellSearch method. Shown are CT scans of the abdomen from 2 patients (A and B) with diffuse colorectal cancer with hepatic metastases and high baseline CTC numbers. CT scans were performed before initiation of chemotherapy (baseline). The scans in panel C provide illustrative examples of the observed inter-patient heterogeneity from 4 patients. The numbers in black depict the ratio of total liver volume: volume of disease free liver, and the numbers in red depict the mean CTC count from replicates +/− standard error of the mean.
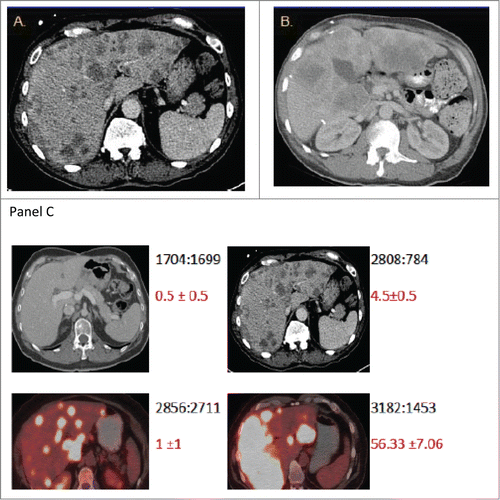
Table 3A. Comparison of incidence of liver and lung metastases between groups with low baseline CTC count (A) at 0–2 cells/7.5ml of blood and high baseline counts (B) of 3 or more CTCs in 7.5ml of blood (p = 0.39, Fisher's exact test).
Table 3B. Comparison of CEA levels between patient groups with low and high CTC counts, respectively (p=0 .018, Fisher's exact test).
Table 3C. Comparison of tumor mutational status between patient groups with low and high CTC counts, respectively (p = 0.67, Fisher's exact test).
Table 3D. Comparison of time interval between the diagnosis of the primary tumor and the appearance of metastases between lowland high baseline CTC count groups (p = 0.35, Fisher's exact test).
Table 4A. Change in CTC counts at first assessment after start of chemotherapy as compared to the counts at baseline assessment prior to treatment.
Table 4B. Change in CTC counts at end-of-chemotherapy assessment as compared to the counts at baseline assessment prior to treatment.
Table 4C. Change in CTC counts at end-of-chemotherapy assessment compared to the counts at baseline assessment prior to treatment in the patients with high CTC counts of 3 or more cells in 7.5 ml of blood at baseline.