Figures & data
Table 1. Patient, tumor and treatment characteristics of the patients included in the study
Table 2: List of 19 informative genes (adjusted p-value = 0.037) discriminating responders and non-responders groups
Figure 1. Hierarchical clustering of 42 patients with rectal carcinomas based on significantly differentially expressed probe sets representing 19 genes (rows) between the subgroup of responders and non-responders (columns) to neoadjuvant chemoradiotherapy. Responders are located on the left branch, Non-responders are clustered on the right branch. Red depicts decreased gene expression; blue indicates increased expression. The two asterisks identify the outliers.
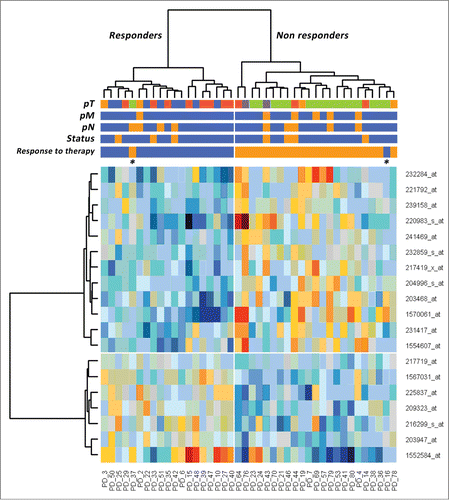
Figure 2. Caspase activation assay on HCT116 and HCT116 p53−/− cells. (A) XRC33 knockdown does not influence caspase activation in HCT116 cells. (B) 5-FU, in combination with XRCC3 knockdown, causes a significant increase of caspase 3/7 activation as compared to control group in HCT116 p53−/− cells. Luminescence is expressed as Relative Light Units (RLU). *: p-value <0.05 compared to control group in t-test with Bonferroni's correction. Error bars represent standard errors of the mean.
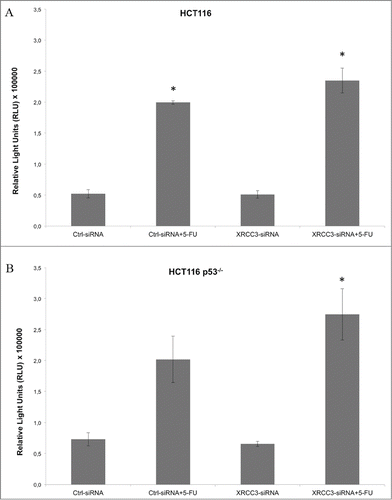
Figure 3. NAViGaTOR PPI network for the 3 of the 4 predictor genes (rectangle nodes).
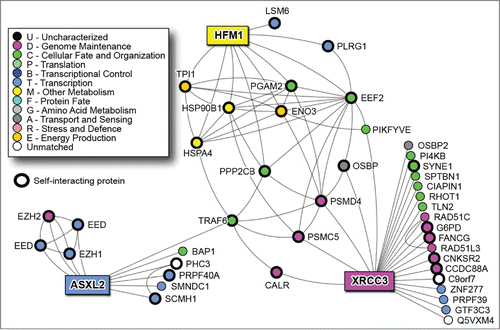
Figure 4. microRNAs targeting the predictor genes PPI network. White squares: microRNAs shared by the 3 genes; pink squares: signature microRNAs described in the literature. The size of the microRNA node corresponds to number of target genes it has. Thick blue lines highlight direct links between predictor genes and corresponding microRNAs.
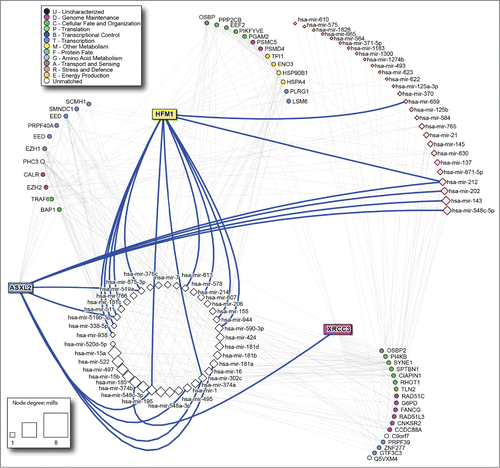
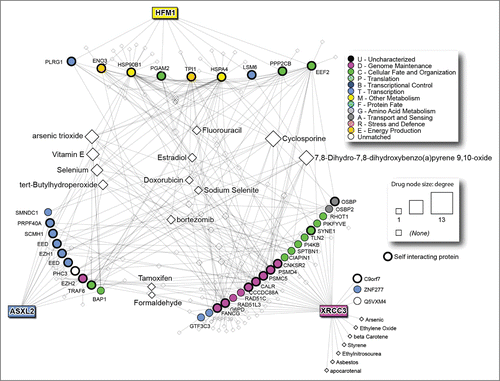
Figure 5. Drugs targeting the predictor genes PPI network. The size of the node corresponds to number of proteins it targets.