1,107
Views
14
CrossRef citations to date
0
Altmetric
Research Papers

Nifurtimox reduces N-Myc expression and aerobic glycolysis in neuroblastoma

, , &
Pages 1353-1363 | Received 24 Feb 2015, Accepted 03 Jul 2015, Published online: 08 Aug 2015

Figures & data

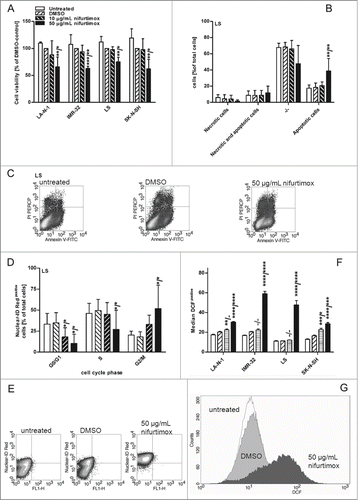
Figure 1. For figure legend, see page .

Figure 1. For figure legend, see page .

Figure 2. Cell viability after nifurtimox and/or topotecan treatment. (A) Data show cell viability of cell line LS (N-Myc amplified) in reference to vehicle control after 48h incubation with topotecan as indicated, growth medium alone (untreated) or vehicle control tested with a MTS cell viability assay. Sample size n = 4. Data show mean ± standard deviation. Significant changes vs. vehicle control tested via ANOVA indicate P < 0.0001 (****). (B) Data show cell viability of cell line LS (N-Myc amplified) in reference to vehicle control after 48h incubation with nifurtimox as indicated or nifurtimox + 0.2 µM topotecan tested with a MTS cell viability assay. Sample size n = 4. Dotted line indicates cell viability after 48h incubation with 0.2 µM topotecan alone. Significant differences were tested with an ANOVA and Sidak-Bonferroni correction for multiple comparison (****: P < 0.0001); “a” indicates significant difference to treatment group 0.2 µM topotecan alone.
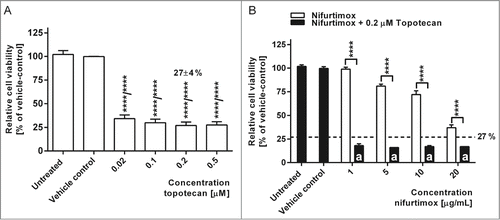
Figure 2. Cell viability after nifurtimox and/or topotecan treatment. (A) Data show cell viability of cell line LS (N-Myc amplified) in reference to vehicle control after 48h incubation with topotecan as indicated, growth medium alone (untreated) or vehicle control tested with a MTS cell viability assay. Sample size n = 4. Data show mean ± standard deviation. Significant changes vs. vehicle control tested via ANOVA indicate P < 0.0001 (****). (B) Data show cell viability of cell line LS (N-Myc amplified) in reference to vehicle control after 48h incubation with nifurtimox as indicated or nifurtimox + 0.2 µM topotecan tested with a MTS cell viability assay. Sample size n = 4. Dotted line indicates cell viability after 48h incubation with 0.2 µM topotecan alone. Significant differences were tested with an ANOVA and Sidak-Bonferroni correction for multiple comparison (****: P < 0.0001); “a” indicates significant difference to treatment group 0.2 µM topotecan alone.

Figure 3. Expression of N-Myc. (A). Data show mRNA expression levels in reference to vehicle control after 24h incubation with nifurtimox as indicated measured with quantitative real time PCR. Sample size n = 3. (B) Data show absolute Cq-values of the data in to illustrate absolute N-Myc mRNA Expression levels using an N-Myc amplified cell line IMR-32 and the non-amplified cell line SK-N-SH. Sample size n = 3. (C) Data show protein expression levels of N-Myc in reference to vehicle control after 4 h incubation with nifurtimox as indicated measured with quantitative western blot (cell line LA-N-1). Data show mean ± standard deviation. Significant changes versus untreated/DMSO tested via ANOVA (A) or unpaired Student's t-test (B) indicate P <0.001 (***).
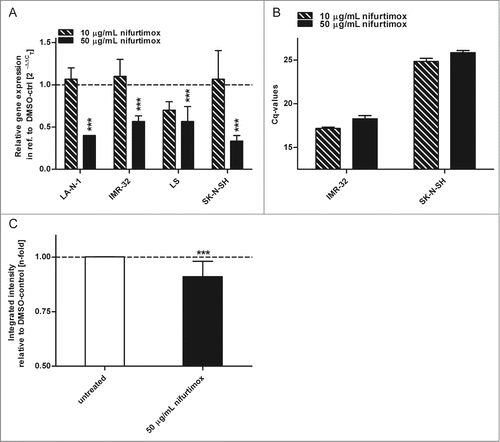
Figure 3. Expression of N-Myc. (A). Data show mRNA expression levels in reference to vehicle control after 24h incubation with nifurtimox as indicated measured with quantitative real time PCR. Sample size n = 3. (B) Data show absolute Cq-values of the data in Fig. 3A to illustrate absolute N-Myc mRNA Expression levels using an N-Myc amplified cell line IMR-32 and the non-amplified cell line SK-N-SH. Sample size n = 3. (C) Data show protein expression levels of N-Myc in reference to vehicle control after 4 h incubation with nifurtimox as indicated measured with quantitative western blot (cell line LA-N-1). Data show mean ± standard deviation. Significant changes versus untreated/DMSO tested via ANOVA (A) or unpaired Student's t-test (B) indicate P <0.001 (***).

Figure 4. Glycolysis. (A) Data show consumption of β-D-(+)-glucose per 4 h in the supernatant growth medium after incubation with nifurtimox or growth medium alone normalized to the number of cells. Consumption of D-Glucose was significantly reduced for LA-N-1 (P = 0.0101), IMR-32 (P = 0.0057), LS (P = 0.0069) and SK-N-SH (P = 0.0078) after treatment with nifurtimox. Experiments were carried out in duplicates and represent one of 3 independent experiments with similar outcome. (B) Data show production of L-lactate per 4 h in the supernatant growth medium after incubation with nifurtimox or growth medium alone normalized to the number of cells. Production of lactate was significantly reduced for LA-N-1 (P = 0.0103), IMR-32 (P = 0.0214), LS (P = 0.0242) but not for SK-N-SH (P = 0.2753) after treatment with nifurtimox. Experiments were carried out in duplicates and represent one of 3 independent experiments with similar outcome. Data show mean ± standard error of the means. Significant changes vs. untreated tested via ANOVA indicate P < 0.05 (*) and P < 0.01 (**).
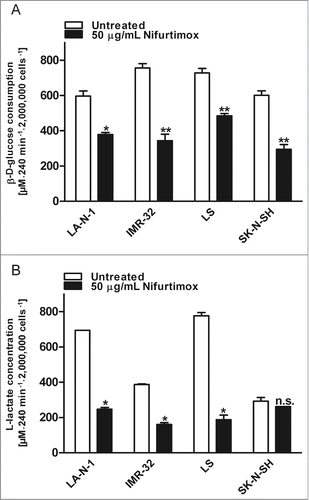
Figure 4. Glycolysis. (A) Data show consumption of β-D-(+)-glucose per 4 h in the supernatant growth medium after incubation with nifurtimox or growth medium alone normalized to the number of cells. Consumption of D-Glucose was significantly reduced for LA-N-1 (P = 0.0101), IMR-32 (P = 0.0057), LS (P = 0.0069) and SK-N-SH (P = 0.0078) after treatment with nifurtimox. Experiments were carried out in duplicates and represent one of 3 independent experiments with similar outcome. (B) Data show production of L-lactate per 4 h in the supernatant growth medium after incubation with nifurtimox or growth medium alone normalized to the number of cells. Production of lactate was significantly reduced for LA-N-1 (P = 0.0103), IMR-32 (P = 0.0214), LS (P = 0.0242) but not for SK-N-SH (P = 0.2753) after treatment with nifurtimox. Experiments were carried out in duplicates and represent one of 3 independent experiments with similar outcome. Data show mean ± standard error of the means. Significant changes vs. untreated tested via ANOVA indicate P < 0.05 (*) and P < 0.01 (**).

Figure 5. Reduction of phospho-PDH levels after treatment with nifurtimox. (A) Data show protein levels of pyruvate dehydrogenase (PDH) and S293-phosphorylated pyruvate dehydrogenase (phospho-PDH) in reference to control after 4h incubation with nifurtimox as indicated or growth medium alone measured with quantitative western blot. Sample size n = 3. Data show mean ± standard deviation. Significant changes versus untreated control tested via unpaired Student's t-test indicate P < 0.01 (**), P < 0.001 (***) and P < 0.0001 (****). (B) Example blots of each cell line; protein bands are combined accordingly.
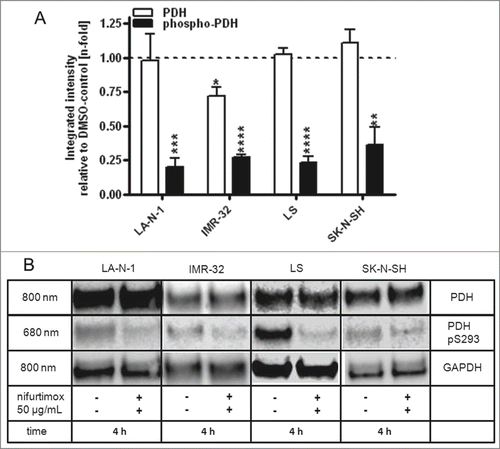
Figure 5. Reduction of phospho-PDH levels after treatment with nifurtimox. (A) Data show protein levels of pyruvate dehydrogenase (PDH) and S293-phosphorylated pyruvate dehydrogenase (phospho-PDH) in reference to control after 4h incubation with nifurtimox as indicated or growth medium alone measured with quantitative western blot. Sample size n = 3. Data show mean ± standard deviation. Significant changes versus untreated control tested via unpaired Student's t-test indicate P < 0.01 (**), P < 0.001 (***) and P < 0.0001 (****). (B) Example blots of each cell line; protein bands are combined accordingly.

Figure 6. Enzyme activity of lactate dehydrogenase after nifurtimox treatment. Data show lactate dehydrogenase enzyme activity after 4 h incubation with nifurtimox as indicated or growth medium alone. One of 3 independent experiments with similar outcome is shown. Data show mean ± standard error of the means. Significant changes vs. untreated control tested via unpaired Student's t-test indicate P < 0.01 (**) and p < 0.001 (***).
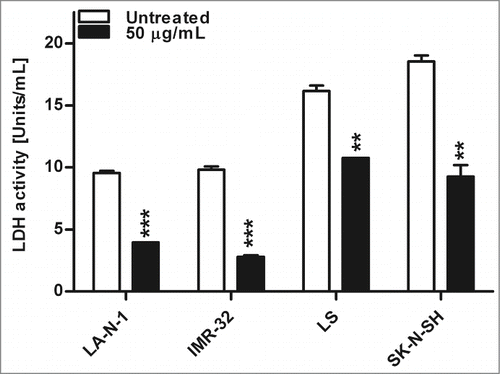
Figure 6. Enzyme activity of lactate dehydrogenase after nifurtimox treatment. Data show lactate dehydrogenase enzyme activity after 4 h incubation with nifurtimox as indicated or growth medium alone. One of 3 independent experiments with similar outcome is shown. Data show mean ± standard error of the means. Significant changes vs. untreated control tested via unpaired Student's t-test indicate P < 0.01 (**) and p < 0.001 (***).

Table 1. Cell line characteristics

Table 2. Ratios of glucose consumption and lactate production after nifurtimox-treatment

Supplemental material

Reprints and Corporate Permissions

Please note: Selecting permissions does not provide access to the full text of the article, please see our help page How do I view content?

To request a reprint or corporate permissions for this article, please click on the relevant link below:

Academic Permissions

Please note: Selecting permissions does not provide access to the full text of the article, please see our help page How do I view content?

Obtain permissions instantly via Rightslink by clicking on the button below:

If you are unable to obtain permissions via Rightslink, please complete and submit this Permissions form. For more information, please visit our Permissions help page.