
Figures & data
Table 1 Clinicopathologic features in 10 HCC patients
Figure 1. Flow chart of the screening process. TaqMan Real-time PCR microRNA Array (Card A) (Applied Biosystems, CA) representing 381 mature miRNAs was used to identify differentially expressed miRNAs from 10 tumor tissue samples (5 from recurrence group vs. Five from non-recurrence group) and the matched serum samples. Of the 40 miRNAs that differentially expressed (fold2- altered) both in tissue and in serum samples, 15 miRNAs have the same variation tendency. And, 4 of the 15 miRNAs were differentially expressed with a p value below 0.10 between recurrence group and non-recurrence group in tissue samples. Four candidate miRNAs were further validated in 116 independent serum samples and 20 tumor tissues
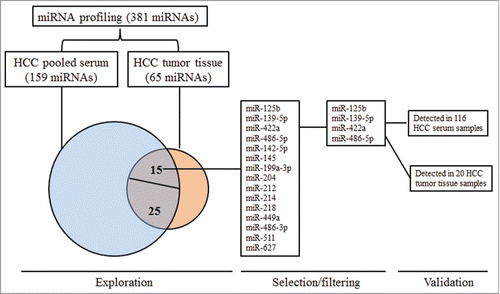
Table 2 Fifteen differentially expressed microRNAs with the same variation tendency in serum and tumor tissue between recurrent and non-recurrent patients
Figure 2. The levels of serum miRNAs were associated with relapse free survival. (A) Patients with low or high expression of miR-486–5p. (B) Patients with low or high expression of miR-422a. (C) Patients with low or high expression of miR-125b. (D) Patients with low or high expression of miR-139–5p
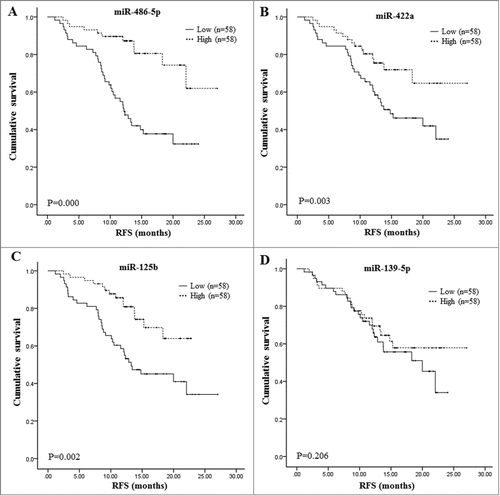
Table 4 Univariate and Multivariate Cox proportional hazards regression analysis of miRNAs and clinical parameters in relation to postoperative recurrence of HCC
Table 5. Correlation between the expression of 4 miRNAs and clinical parameters of 116 HCC patients underwent hepatectomy
Figure 3. Positive correlations between the expression levels in tumor tissues and the paired serum samples
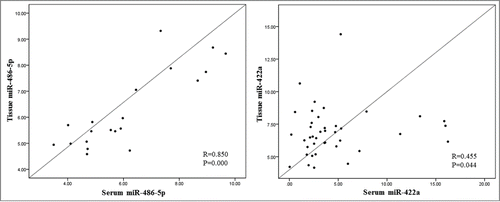
Figure 4. Receiver operating characteristic curve analysis for predicting prognostic accuracy of postoperative recurrence of HCC patients. (A) ROC curve for miR-486–5p yielded area under the curve (AUC) of 76.79%, the sensitivity of 81.58% and specificity of 65.38% in predicting prognosis. (B) ROC curve for AFP and microvascular invasion yielded AUC of 75.98%, the sensitivity of 85.90% and specificity of 63.13% in predicting prognosis. MVI: microvascular invasion. (C) ROC curve for combination of AFP, MVI and miR-486–5p yielded AUC of 88.02%, the sensitivity of 69.20% and specificity of 92.10% in predicting prognosis
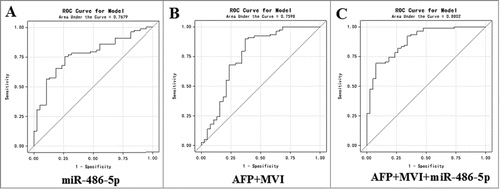
Table 3. Clinicopathologic features in 116 HCC patients underwent hepatectomy