Figures & data
Figure 1. Bisindole-PBD conjugate chemical structure, Cell proliferation studies and wound healing assays. (A) Chemical structure of SAHA and bisindole-PBD conjugate (5b). (B-C) Effects of SAHA and 5b on MCF-7 and MDA-MB-231 cell proliferation at 4 μM and the images of the colonies along with untreated controls. The numbers of colonies were counted from 3 independent results and plotted to compare the effect of 5b. 5b was more efficient in inhibiting cell proliferation. Histograms were drawn from 3 independent experiments. Error bars with *** represents P<0.001 and ** represents p<0.01. (D, E) Scratched monolayer of cells was treated with SAHA and 5b at 4 μM. Cell migration was photographed after stimulation with drug at 48 hour time point.
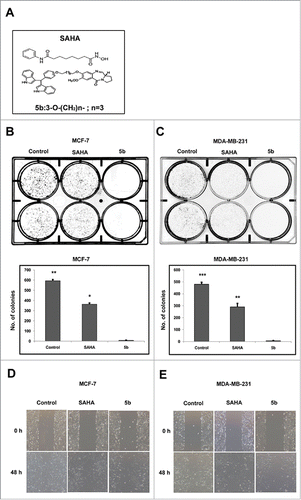
Figure 2. mRNA expression level of proapoptotic Bcl-2 family members. Cells were treated with 50 μM of Sirtinol, 4 μM of SAHA and 4 μM of 5b and were incubated for 24 h. (A, B) RT-PCR analysis of different members of the family indicating the level of mRNA expression after treatment. (C, D) Histograms represent relative expression of gene levels to internal control GAPDH. Plots are mean values from 3 independent experiments. Error bars represent standard deviation.
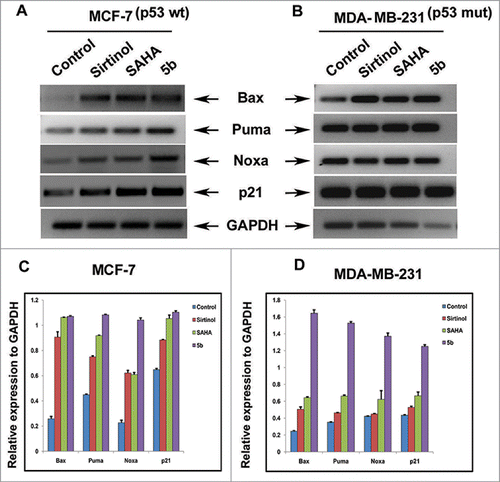
Figure 3. Western blot analysis showing that Bisindole PBD (5b) dampens the prosurvival PI3K/AKT/mTOR signaling pathway in breast cancer cells. (A, B) Proteins extracted from MCF-7 and MDA-MB-231 cells incubated with 4 μM of SAHA and 4, 8 μM of 5b for 24 h along with DMSO (0.1%) treated control cells were immunoblotted and hybridized with antibodies against AKT, p-AKT, PI3K and mTOR to check the level of expressions. β-Actin was used as gel loading control. The relative expression of proteins from 3 independent blots was plotted in histograms. Bars with * are significantly different from other groups p ≤ 0.01 except that they bear same symbol. In case of MDA-MB-231 histogram, bars with ** are significantly different from other groups p ≤ 0.01 and Bars with * are significantly different from other groups p ≤ 0.05 except that they bear same symbol. (C, D) Co- treatment with Q-VD-OPH 500 nm, SAHA 4 μM and 5b 4 μM was given to examine the expression pattern of AKT, p-AKT, PI3K and mTOR protein levels. β-Actin was used as loading control. Histograms represent data from 3 independent experiments. Data are represented as the mean ± SD. *P < 0.05.
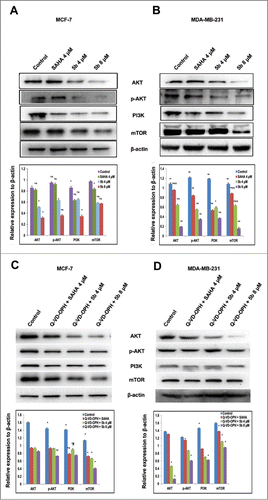
Figure 4. 5b down modulates levels of SIRTs both at transcriptional level and post transcriptional level. (A, B) Cells treated with Sirtinol and 5b was subjected to qRTPCR with SIRT primers taking GAPDH as endogeneous control. Relative expression has been shown with respect to GAPDH. (C) Cells were pretreated with Sirtinol 50 μM and 5b 4 μM for 24 h. Downregulation of SIRT protein levels were assessed by western blot. β- actin was used as loading control. Data are shown as the mean + SD. All these data were obtained from 3 independent experiments and a representative figure has been shown from 3 replicates.
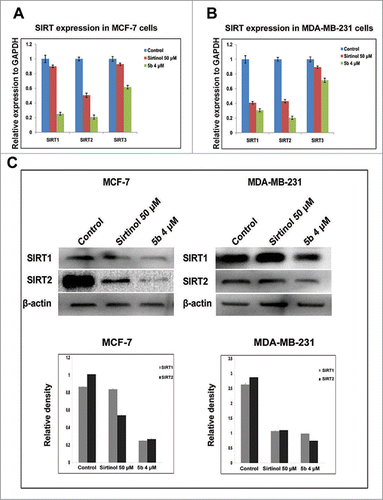
Figure 5. Immunocytochemical expression of SIRT1 and SIRT2 in breast cancer cells after compound treatment and docking study between SIRT2 and 5b. MCF-7 and MDA-MB-231 cells were treated with 50 μM of Sirtinol and 4 μM of 5b for 24 h and fixed for immunocytochemical analysis of SIRT1 and SIRT2. (A-B) Reduced expression of cytoplasmic localized SIRT1 was observed after 5b treatment. Images were taken by using 60X oil objective under confocal microscope. Bar scale represents here 10 µM. (C-D) Diminished level of SIRT2 was observed after incubation with Sirtinol and 5b. Bars represent 10 µM. (E) Molecular modeling showed binding between 5b and SIRT2 (with different amino acids residues). Figure showed receptor-ligand Hydrogen bonds (Green) and Receptor-ligand bumps of 5b with active site residues of SIRT2 protein.
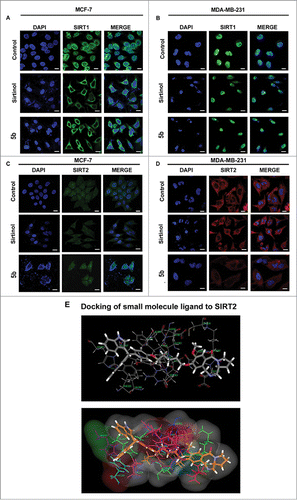
Figure 6. Effect of 5b on post translational modifications of p53 and tubulin acetylation. (A, B) Proteins extracted from cells treated with indicated doses of Sirtinol, SAHA and 5b for 24 h were immunoblotted with antibody specific to acetylated tubulin, p53, acetylated p53(Lys373), acetylated p53(Lys382), phospho p53(Ser20), phospho p53(Ser15)and NF-kB. β-actin was taken as loading control. ‘*’ p < 0.05; bars with same symbols are dissimilar statistically. (C, D) Immunofluorescence studies with anti-acetylated tubulin of cells after treatment with 5b. Images were observed under confocal microscope (Olympus FV1000) and processed with flow view version 1.7c software program. Bar represents 10 µM scales. (E, F) Pretreated cells were subjected to protein gel blot to decipher the role of 5b upon HDAC6 expression. Relative density has been calculated taking β-actin as loading control. Bars represent mean + SD.
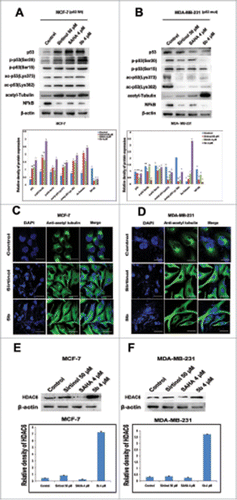
Figure 7. Effect of 5b on histone acetylation and methylation. (A) Treatment with 5b at 4, 8 μM concentrations for 24 h in MCF-7 and MDA-MB-231 cells significantly induced the level of acetylated histone H4 as compared to DMSO (0.1%) control. (B, C) Immunofluorescence studies with anti-acetyl histone H4 antibody on cells treated with 5b showed profound expression of acetylated histone H4. (D, F) Metaphase spreads isolated from MCF-7 and MDA-MB-231 cells treated with SAHA and 5b at 4 μM concentration for 24 h and control untreated cells hybridized with histone H3K14ac antibody. (E, G) Percentage of H3K14ac foci is shown. Error bar represents standard deviation from 3 different experiments. Bars with * are significantly different from all the other groups at p ≤ 0.01.
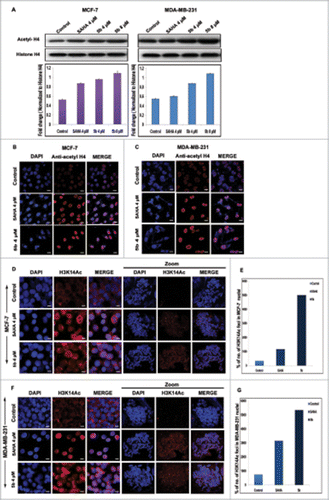
Figure 8. Effect of 5b on histone modifications and sp1 at p21 promoter in MCF-7 and MDA-MB-231 cells. (A) Schematic diagram of the human p21WAF1 promoter illustrating regulatory factor binding sites;−2260 (p53), −2080 (sp1-distal) and −100 (sp1 proximal). Arrow indicates transcriptional start site at +1. (B) Two different binding sites (distal and proximal) of sp1 in the p21 promoter were considered for ChIP analysis after treating the cells with SAHA and 5b at 4 μM concentration for 24 h. H3K9ac, H3K14ac, H3K9Me2 and H3K27me3 antibodies were used for the study. (B-G) Representation of gel pictures of chromatin DNA amplified with distal and proximal promoter specific primers and their respective histograms. Each experiment was performed thrice from which standard deviation derived and error bars were plotted. Bars with * and ** are significantly different from all the other groups at p ≤ 0.05 and p ≤ 0.01 respectively; bars with ˆ superscript are indifferent from each other in Oneway-ANOVA, posthoc-LSD in MCF-7. In MDA-MB-231 bars with * and ** are significantly different from all the other groups at p ≤ 0.05 and p ≤ 0.01 respectively in Oneway-ANOVA, posthoc-LSD.
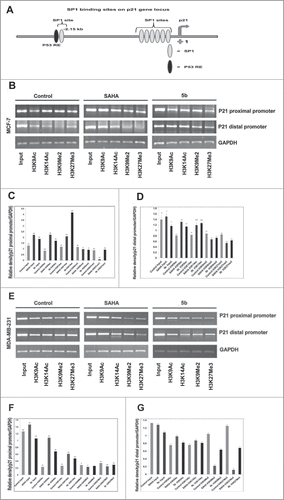
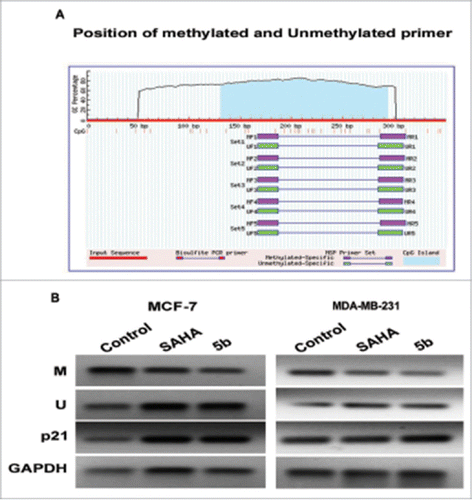
Figure 9. Methylation analysis at the p21 promoter by MSP in MCF-7 and MDA-MB-231 cells. (A) Genomic sequence of the p21 promoter (www.urogene.org/methprimer) revealed the presence of a high content of GC in CpG islands (blue). Methylated and unmethylated primers for p21 were desingned from Methprimer software. (B) Expression of the methylated and unmethylated DNA estimated by methylated and unmethylated primers obtainded from methprimer software. M primer anneal only to methylated sequences and U primer anneal unmethylated sequences. We took primer set 1 from the software output.