2,650
Views
13
CrossRef citations to date
0
Altmetric
Research Papers

A targeted IL-15 fusion protein with potent anti-tumor activity

, , , , , , & show all
Pages 1415-1421 | Received 29 Apr 2015, Accepted 04 Jul 2015, Published online: 20 Aug 2015

Figures & data

Figure 1. In vitro characterization of the PFC-1 fusion protein. (A) Schematic representation of PFC-1. SP, signal peptide; RGD, Arg-Gly-Asp peptide motif; Fc, CH2 and CH3 of human IgG1; IL-15Ra, IL-15Rα sushi domain including the subsequent 12 amino acids from exon 3; L1, SS; L2, G4S; L4, SG2SG4SG3SG4SLQ. (B) Coomassie blue staining of the fusion protein developed from 10% SDS-PAGE under non-reducing (NR) or reducing (R) conditions. (C) Mo7e proliferation stimulated by rhIL-15 and PFC-1. (D) CTLL-2 proliferation stimulated by rhIL-15 and PFC-1. The concentration was calculated according to the molecular weight of a PFC-1 monomer. The data are shown as the mean ± SD of triplicate samples and the lines represent the sigmoidal dose-response curve fit for EC50 determination. The results are representative of at least 3 experiments.
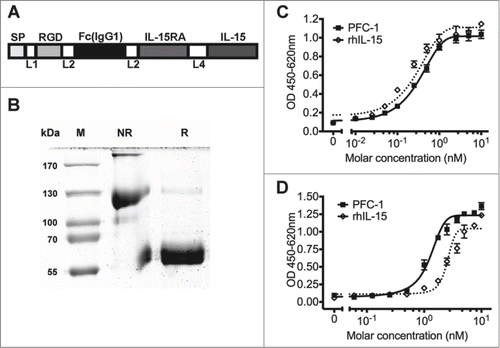
Figure 1. In vitro characterization of the PFC-1 fusion protein. (A) Schematic representation of PFC-1. SP, signal peptide; RGD, Arg-Gly-Asp peptide motif; Fc, CH2 and CH3 of human IgG1; IL-15Ra, IL-15Rα sushi domain including the subsequent 12 amino acids from exon 3; L1, SS; L2, G4S; L4, SG2SG4SG3SG4SLQ. (B) Coomassie blue staining of the fusion protein developed from 10% SDS-PAGE under non-reducing (NR) or reducing (R) conditions. (C) Mo7e proliferation stimulated by rhIL-15 and PFC-1. (D) CTLL-2 proliferation stimulated by rhIL-15 and PFC-1. The concentration was calculated according to the molecular weight of a PFC-1 monomer. The data are shown as the mean ± SD of triplicate samples and the lines represent the sigmoidal dose-response curve fit for EC50 determination. The results are representative of at least 3 experiments.

Figure 2. PBMC proliferation stimulation in vitro by PFC-1. CFSE-labeled PBMCs were incubated with various concentrations of rhIL-15 or PFC-1 for 6 d Proliferation of PBMCs was assessed by flow cytometry. (A) Representative FACS images of PBMC proliferation are shown. (B) Quantitative analysis of PBMC proliferation stimulation by rhIL-15 or PFC-1. The concentration was calculated according to the molecular weight of a PFC-1 monomer. The data are shown as the mean ± standard deviation of triplicate samples. The results are representative of 3 experiments. The t test was used for statistical analysis with p < 0.05.
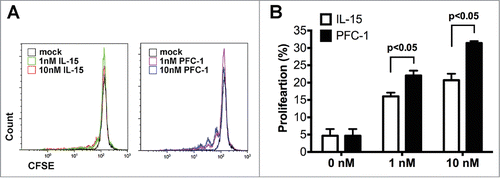
Figure 2. PBMC proliferation stimulation in vitro by PFC-1. CFSE-labeled PBMCs were incubated with various concentrations of rhIL-15 or PFC-1 for 6 d Proliferation of PBMCs was assessed by flow cytometry. (A) Representative FACS images of PBMC proliferation are shown. (B) Quantitative analysis of PBMC proliferation stimulation by rhIL-15 or PFC-1. The concentration was calculated according to the molecular weight of a PFC-1 monomer. The data are shown as the mean ± standard deviation of triplicate samples. The results are representative of 3 experiments. The t test was used for statistical analysis with p < 0.05.

Figure 3. PFC-1 binding to αVβ3 integrin (CD51/61) and co-localization with αVβ3 integrin (CD51/61). Flow cytometry analysis of PFC-1 binding to αVβ3 integrin on (A) HUVEC and (B) SKOV3 cells. Anti-αVβ3 integrin (CD51/61) is in the left panel and PFC-1 is in the right panel. (C). Confocal microcopy of PFC-1 co-localization with αVβ3 integrin (CD51/61) in HUVEC cells (upper panel) and SKOV3 cells (lower panel). The bar scale represents 20 μm.
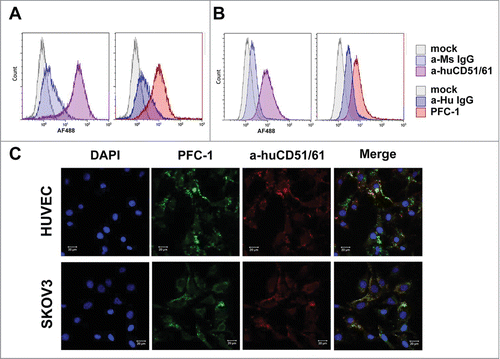
Figure 3. PFC-1 binding to αVβ3 integrin (CD51/61) and co-localization with αVβ3 integrin (CD51/61). Flow cytometry analysis of PFC-1 binding to αVβ3 integrin on (A) HUVEC and (B) SKOV3 cells. Anti-αVβ3 integrin (CD51/61) is in the left panel and PFC-1 is in the right panel. (C). Confocal microcopy of PFC-1 co-localization with αVβ3 integrin (CD51/61) in HUVEC cells (upper panel) and SKOV3 cells (lower panel). The bar scale represents 20 μm.

Figure 4. In vivo anti-tumor activity of PFC-1. C57BL/6 mice transplanted with B16F10 melanoma cells received 5 or 20 μg PFC-1 or vehicle (200 μl per mouse, i.p.) on indicated days (arrow) every 3 d for 2 treatments in total. Then, tumor volumes were measured correspondingly. The data are shown as the mean ± SD; n = 5˜8; **, p < 0.01, t test.
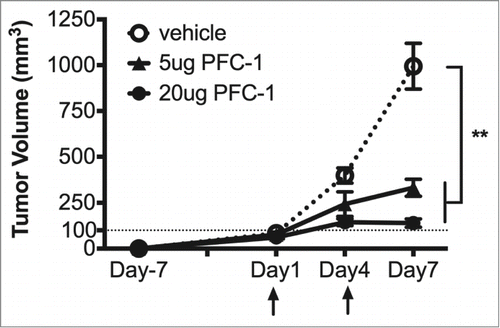
Figure 4. In vivo anti-tumor activity of PFC-1. C57BL/6 mice transplanted with B16F10 melanoma cells received 5 or 20 μg PFC-1 or vehicle (200 μl per mouse, i.p.) on indicated days (arrow) every 3 d for 2 treatments in total. Then, tumor volumes were measured correspondingly. The data are shown as the mean ± SD; n = 5˜8; **, p < 0.01, t test.

Figure 5. PFC-1 in vivo anti-tumor efficacy on established large B16F10 tumor xenografts. (A) C57BL/6 mice with large established B16F10 tumor (1000 mm3) xenografts received 10 μg/mouse PFC-1 or vehicle (200 µl) i.v treatment son indicated days (arrow) and tumor volumes were measured correspondingly. (B) The CD8+T cell ratio (top) and NK cell ratio (bottom) were measured in the blood, spleen and tumor after mice were euthanized on day 7. (C) The change in the CD44 ratio in the CD8+T cells and NK cells was also measured in the blood, spleen and tumor by flow cytometry. The data are shown as the mean ± SD; n = 5˜8; **, p < 0.01; ***, p < 0.005, t test.
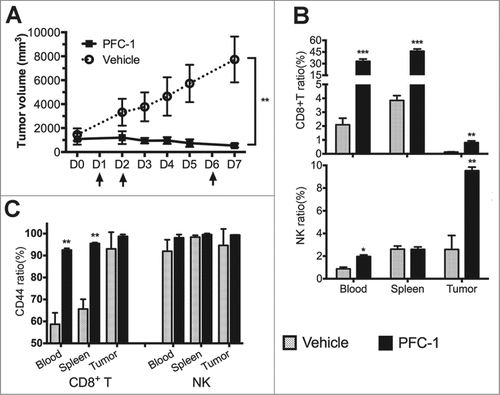
Figure 5. PFC-1 in vivo anti-tumor efficacy on established large B16F10 tumor xenografts. (A) C57BL/6 mice with large established B16F10 tumor (1000 mm3) xenografts received 10 μg/mouse PFC-1 or vehicle (200 µl) i.v treatment son indicated days (arrow) and tumor volumes were measured correspondingly. (B) The CD8+T cell ratio (top) and NK cell ratio (bottom) were measured in the blood, spleen and tumor after mice were euthanized on day 7. (C) The change in the CD44 ratio in the CD8+T cells and NK cells was also measured in the blood, spleen and tumor by flow cytometry. The data are shown as the mean ± SD; n = 5˜8; **, p < 0.01; ***, p < 0.005, t test.

Figure 6. Effect of PFC-1 on the B16F10 melanoma metastasis model. C57BL/6 mice were i.v. injected with 5*105 B16F10 melanoma cells on day 0 and a single dosage of 10 μg PFC-1 or equal volume of vehicle was administered. On day 21, the lungs were removed and metastasis nodes were counted. (Top) A representative figure of the lungs and (bottom) the lung metastasis number. The data are shown as the mean ± SD, n = 5 , t test.
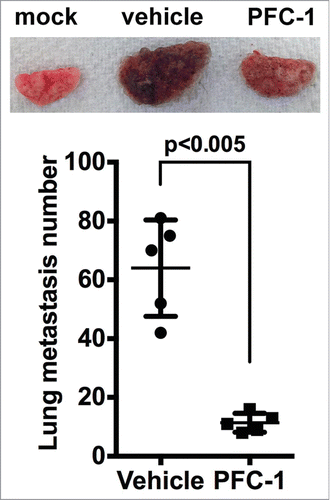
Figure 6. Effect of PFC-1 on the B16F10 melanoma metastasis model. C57BL/6 mice were i.v. injected with 5*105 B16F10 melanoma cells on day 0 and a single dosage of 10 μg PFC-1 or equal volume of vehicle was administered. On day 21, the lungs were removed and metastasis nodes were counted. (Top) A representative figure of the lungs and (bottom) the lung metastasis number. The data are shown as the mean ± SD, n = 5 , t test.
Supplemental material

Supplementary Figures

Download MS Word (695.8 KB)

Reprints and Corporate Permissions

Please note: Selecting permissions does not provide access to the full text of the article, please see our help page How do I view content?

To request a reprint or corporate permissions for this article, please click on the relevant link below:

Academic Permissions

Please note: Selecting permissions does not provide access to the full text of the article, please see our help page How do I view content?

Obtain permissions instantly via Rightslink by clicking on the button below:

If you are unable to obtain permissions via Rightslink, please complete and submit this Permissions form. For more information, please visit our Permissions help page.