Figures & data
Figure 1. Mw suppresses proliferation and invasion of B16F10 cells. (A) MTT assay of Mw (dose; 0, 104 −108 cells/ml) for 24hr and 48hr on melanocyte, B16F10 and B16F1 cells were analyzed. The experiment was repeated thrice and expressed as mean ± SD.π P< 0.05,ππ P< 0.01; *P< 0.05, **P< 0.01 versus untreated for 24hr and 48hr. (B) Effects of Mw on cell viability were assayed by Trypan blue exclusion assay for 24hr and 48hr. The experiment was repeated thrice and expressed as mean ± SD.ππ P < 0.01; **P < 0.01 vs. untreated for 24hr and 48hr. (C) Antiproliferative effect of Mw for 24hr and 48hr were measured by [3 H]–Thymidine incorporation. Triplicate results were expressed as mean ± SD.ππ P < 0.01; **P < 0.01 versus untreated cells for 24hr and 48hr. (D) Clonogenicity of B16F10 and B16F1 cells treated with Mw was assessed by soft agar colony assay. Results were expressed as mean ± SD. *P < 0.05, **P < 0.001 vs untreated. (E) Invasion assay was carried out in 12-well transwell after Mw treatment for 2hr. The randomly chosen fields were photographed (20X), and the number of cells migrated to the lower surface was calculated. Data are mean ± SD of 3 independent experiments. *P < 0.05, **P < 0.001 vs untreated. (F) Confluent cells were treated with Mw and scratched. After 24hr, the number of cells migrated into the scratched area was photographed (20X) and calculated. Data are mean ± SD of 3 independent experiments. *P< 0.05, and **P< 0.001 vs untreated. (G) Cell adhesion was carried out in a 12-well plate coated with matrigel and treated with Mw for 2hr. Attached cells were photographed (20X) and calculated. Data are mean ± SD of 3 independent experiments.*P< 0.05, **P< 0.001 vs untreated.
![Figure 1. Mw suppresses proliferation and invasion of B16F10 cells. (A) MTT assay of Mw (dose; 0, 104 −108 cells/ml) for 24hr and 48hr on melanocyte, B16F10 and B16F1 cells were analyzed. The experiment was repeated thrice and expressed as mean ± SD.π P< 0.05,ππ P< 0.01; *P< 0.05, **P< 0.01 versus untreated for 24hr and 48hr. (B) Effects of Mw on cell viability were assayed by Trypan blue exclusion assay for 24hr and 48hr. The experiment was repeated thrice and expressed as mean ± SD.ππ P < 0.01; **P < 0.01 vs. untreated for 24hr and 48hr. (C) Antiproliferative effect of Mw for 24hr and 48hr were measured by [3 H]–Thymidine incorporation. Triplicate results were expressed as mean ± SD.ππ P < 0.01; **P < 0.01 versus untreated cells for 24hr and 48hr. (D) Clonogenicity of B16F10 and B16F1 cells treated with Mw was assessed by soft agar colony assay. Results were expressed as mean ± SD. *P < 0.05, **P < 0.001 vs untreated. (E) Invasion assay was carried out in 12-well transwell after Mw treatment for 2hr. The randomly chosen fields were photographed (20X), and the number of cells migrated to the lower surface was calculated. Data are mean ± SD of 3 independent experiments. *P < 0.05, **P < 0.001 vs untreated. (F) Confluent cells were treated with Mw and scratched. After 24hr, the number of cells migrated into the scratched area was photographed (20X) and calculated. Data are mean ± SD of 3 independent experiments. *P< 0.05, and **P< 0.001 vs untreated. (G) Cell adhesion was carried out in a 12-well plate coated with matrigel and treated with Mw for 2hr. Attached cells were photographed (20X) and calculated. Data are mean ± SD of 3 independent experiments.*P< 0.05, **P< 0.001 vs untreated.](/cms/asset/8c587ddb-78c0-47ca-b40b-9e41f0373bdd/kcbt_a_1078024_f0001_oc.gif)
Figure 2. Mw suppresses transcription factors mediated B16F10 cell invasion. (A) 2×10⁶ melanocytes, B16F1 and B16F10 cells were collected for mRNA extraction and real time PCR analyses of MMP-1, MMP-2, MMP-3, MMP-7, MMP-9, MMP-13 and MMP-14. Relative expression of target gene with respect to GAPDH was presented as mean ± SD, *P< 0.05, **P< 0.01 vs melanocytes. (B) 2×10⁶ B16F10 cells were treated with Mw for 2hr and the activity of MMP-2 and MMP-9 was assessed by gelatin zymography. Data are representative of 3 independent experiments. (C) 2×10⁶ B16F10 cells were treated with Mw and MMP-2 and MMP-9 gene expression was detected by real time PCR. Relative expression of target gene with respect to GAPDH were performed thrice and expressed as mean ± SD. **P< 0.01 vs. untreated cells. (D) Western blot was performed in similarly treated cell to detect MMP-2 and MMP-9 using specific antibodies with anti-GAPDH as reference. (E) B16F10 cells were incubated in Matrigel-coated transwell with or without PMA and MMP-9 inhibitor for 24hr. Attached cells were photographed (20X) and calculated. Data are mean ± SD of 3 independent experiments.*P< 0.05, **P< 0.001 vs untreated. (F) 2×10⁶ B16F10 cells treated with Mw were subjected to western blot to detect pIκBα, IκBα, pP65, P65, pc-Fos, c-Fos, pc-Jun, c-Jun using specific antibodies. (G) Cytoplasmic and nuclear fractions of B16F10 cells were subjected to protein gel blot to study nuclear translocation of P65 and c-Jun with GAPDH and LaminB as reference. (H) 2×10⁶ B16F10 cells treated with Mw (106 cells/ml) were immunoprecipitated using NF-κB (IP: NF-κBP65) and AP-1(IP: c-Jun) specific antibody. Semi quantitative RT-PCR was performed to amplify the putative NF-κB and AP-1 binding sites at the MMP-9 promoter. Data are from one representative experiment performed at least thrice.
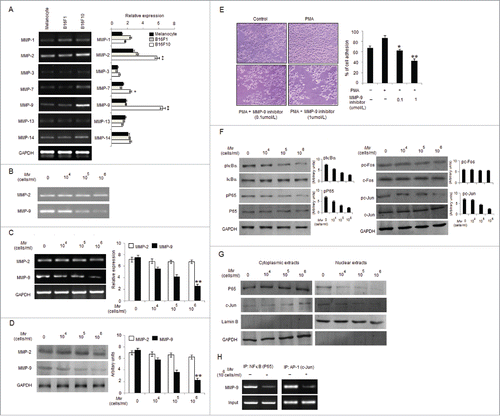
Figure 3. Mw overcomes the facilitative effects of PMA on B16F10 cell invasion. (A) B16F10 cells preincubated with Mw for 2hr and the cell suspension containing Mw and PMA (80nM) was seeded onto the upper well of 12-well microchemotaxis chambers. The randomly chosen fields were photographed (20X). The number of cells migrated to the lower surface was calculated. Data are mean ± SD of 3 independent experiments.πP < 0.05 versus untreated, *P< 0.05, **P< 0.001 vs. PMA alone. (B) 2×10⁶ B16F10 cells were pretreated with Mw for 2hr and then stimulated with 80nM PMA for 24hr. The activity of MMP-2 and MMP-9 was assessed by gelatin zymography. (C) Western blot was performed in similarly treated cell to detect MMP-2 and MMP-9 using specific antibodies with anti-GAPDH as reference. (D) 2×10⁶ B16F10 cells pretreated with Mw for 2hr and stimulated with 80nM PMA for 24hr. Gene expression of MMP-2, MMP-9, MMP-7, TIMP-1 and TIMP-2 was detected by RT- PCR analysis with GAPDH as control. (E) The protein expression of pIκBα, IκBα, pP65, P65, pc-Fos, c-Fos, pc-Jun, c-Jun and anti-GAPDH was assessed by western blot in B16F10 cells pretreated with Mw for 2hr and stimulated with 80nM PMA for 24hr using specific antibodies. (F) B16F10 cells treated similarly were immunoprecipitated using NF-κB (IP: NF-κB) and AP1 (IP: c-Jun) specific antibody. Semi quantitative RT-PCR amplified the putative NF-κB and AP1 binding sites at the MMP-9 promoter. Data are from one representative experiment performed at least thrice.
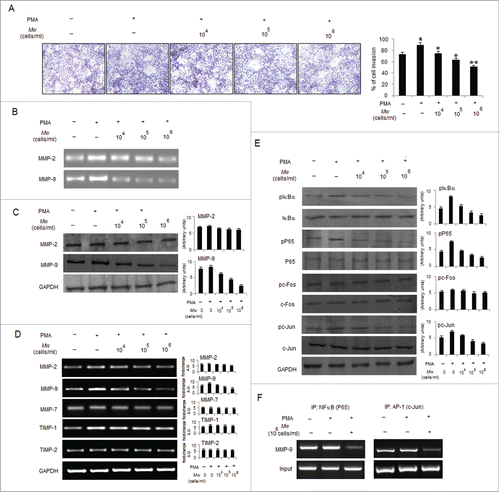
Figure 4. Mw inhibits PMA-induced PKCα mediated B16F10 cell invasion. (A) B16F10 cells were treated with 80nM PMA, and PKC isotypes were analyzed in cytosol and membrane fractions by protein gel blotting. (B) B16F10 cells were pretreated for 1hr with Gö6976 (2uM), Rottlerin (0.5uM) or GF109203X (2uM), followed by 80nM PMA stimulation for 24hr. The MMP-9 mRNA (top), protein (middle) expression and activity (bottom) was analyzed by semi-quantitative RT-PCR, western blot and gelatin zymography respectively. Data are from one of 3 representative experiments. (C) Invasion assay was carried out in cells stimulated with 80nM PMA for 24hr after pretreatment with PKC inhibitors for 1hr. The randomly chosen fields were photographed (20X), and the number of cells migrated to the lower surface was calculated. Data are mean ± SD of 3 independent experiments. **P < 0.001 vs PMA alone treatment. (D) Confluent cells were scratched and treated with 80nM PMA for 24hr after pretreatment with PKC inhibitors for 1hr. The number of cells migrated into the scratched area was photographed (20X) and calculated. Data are shown as the mean ± SD of 3 independent experiments. **P< 0.001 vs PMA alone treatment. (E) B16F10 cells transfected with empty vector (EV), overexpressed full-length mouse PKCα (PKCαOV) or PKCδ (PKCδOV) isotypes as mentioned in materials and methods were subjected to semi-quantitative RT-PCR, protein gel blot and gelatin zymography for MMP-9 expression and activity respectively. Data are from one of 3 representative experiments. (F) B16F10 cells were pretreated with Mw for 2hr and then stimulated with 80nM PMA for 24hr. Western blot analysis was performed to detect the PKCα and PKCδ level in cytosol and membrane fractions. (G) B16F10 cells, transfected with overexpressed full-length mouse PKCα (PKCαOV) isotype were treated with Mw for 2hr followed by 80nM PMA stimulation for 24hr. The MMP-9 mRNA (top), protein (middle) expression and activity (bottom) were analyzed by semi-quantitative RT-PCR, western blot and gelatin zymography respectively. Data are from one of 3 representative experiments.
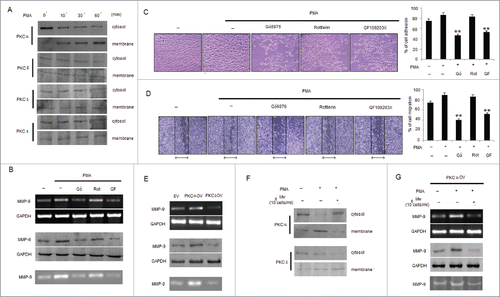
Figure 5. Mw inhibits PMA-induced transcriptional activation of MMP-9 and phosphorylation of ERK1/2 and AKT in B16F10 cells. (A) 2×10⁶ B16F10 cells were treated with Mw and the expression of phospho/total MAPKs and AKT were determined by protein gel blotting. (B) 2×10⁶ B16F10 cells preincubated with Mw for 2hr followed by 80nM PMA for 24hr were subjected to western blot using antibodies specific to total/phospho MAPKs and AKT. Data are from one of 3 representative experiments with similar results. (C) Cells were treated with specific inhibitors of MAPKs or AKT for 1hr and then stimulated with PMA for 24hr. The MMP-9 mRNA (top), protein expression (middle) and activity (bottom) were analyzed by semi-quantitative RT-PCR, protein gel blot and gelatin zymography respectively. (D) Similarly cells were preincubated with specific inhibitors of MAPKs or AKT for 1hr and then stimulated with PMA for 24hr was seeded onto the upper chamber wells. After incubation for 24hr at 37°C, the filter was fixed and stained. The randomly chosen fields were photographed (20X). Data are shown as the mean ± SD of 3 independent experiments. **P< 0.001 vs PMA alone treatment. (E) B16F10 cells treated with specific inhibitors of MAPKs or AKT for 1hr and then stimulated with PMA for 24hr were subjected to immunoprecipitation using NF-κB (IP: NF-κBP65) and AP-1 (IP: c-Jun) specific antibody. Semi quantitative RT-PCR amplify the putative NF-κB and AP1 binding sites at the MMP-9 promoter. Data are from one representative experiment performed at least thrice. (F) Cells were stimulated with 80nM PMA for 24hr after pretreatment with PKC inhibitors for 1hr, and the levels of total/phospho MAPKs and AKT were determined by western blotting. Data are from one of 3 representative experiments.
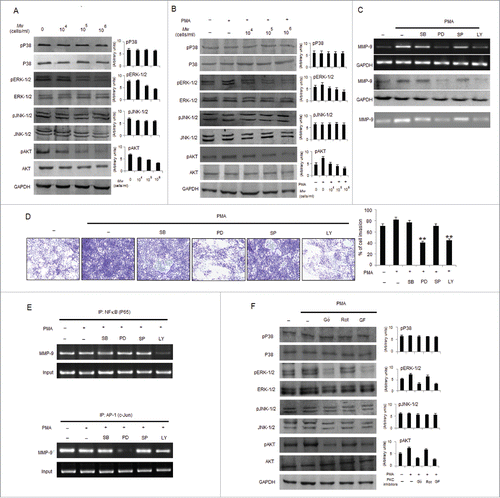
Figure 6. In vivo therapeutic efficacy of Mw on melanoma cancer models. (A) 3×10⁵ B16F10 cells were injected in the right flank of C57BL/6 mice on day 0. Mw (107 bacilli/mouse) was given intradermally (i.d.) at the tumor site twice within 15 d interval starting from day 3 of tumor implantation. Tumor growth and animal body weight was measured twice per week. Data are mean ± SD values obtained from 5-mice/group. *P< 0.05 vs PBS treated mouse. (B) Mw treatment did not affect animal body weight. (C) MMP-9, MMP-2, PKCα, PKCδ expression in B16F10 tumor treated with Mw was detected by real time PCR analysis. Data are mean ± SD obtained from 5-mice/group. *P< 0.05, **P< 0.01 vs PBS treated mouse. (D) Expression of MMP-9, MMP-2, PKCα, and PKCδ in B16F10 tumor treated with Mw was detected by tumor immunofluorescence staining. (E) Signaling pathway where Mw inhibits B16F10 melanoma cancer cell invasion and migration.
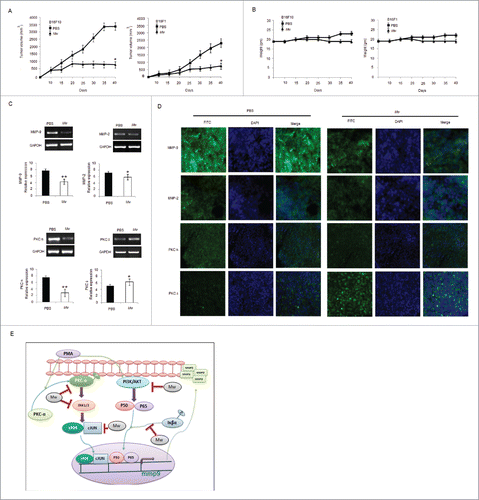
Table 1 List of primers
