Figures & data
Figure 1. Loss of CD151 or CD151-integrin interaction reduces the tightness of cell-cell junctions. (A-E) Electron micrographs of cell-cell junctions within monolayers of A431 parental cells (WT), CD151sh3 cells, CD151-VR cells, CD151-Palm cells, or CD151 WTRX cells. The rectangular area in each micrograph was zoomed and rotated to vertical to the right of each image. (F) The percentage of each junction filled with cross interacting membrane and filopodia was calculated as described in Experimental Procedures. Bars show mean with SEM for 13–17 fields per cell type. The sh3 and VR cell junctions were significantly less densely packed than the WT cell junctions, ***P ≤ 0.0006 (ANOVA with Dunnett's post-test). Bar = 1 µm.
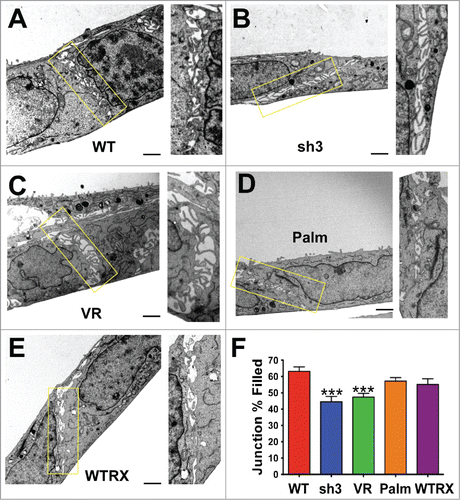
Figure 2. Loss of organized cell-cell junctions in CD151-silenced cells. A431 parental and CD151sh3 cells expressing E-cadherin-GFP (green) were fixed and stained for CD151 (red). DAPI-stained nuclei are shown in blue in the overlay image.
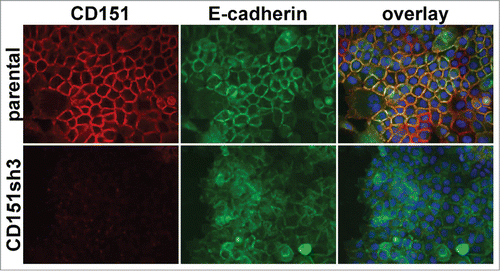
Figure 3. Loss of organized cell-cell junctions in α3 integrin-silenced cells. Integrin α3 was silenced with 2 different shRNA constructs in E-cadherin-GFP-expressing A431 cells. The α3 silenced cells and parental A431 cells expressing E-cadherin-GFP (green) were fixed and stained for α3 integrin (red). DAPI-stained nuclei are shown in blue in the overlay image.
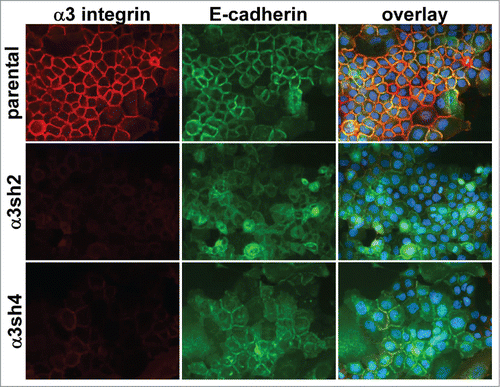
Figure 4. A function-blocking anti-α3 integrin antibody perturbs cell junctions. Parental A431 cells expressing E-cadherin-GFP (green) were left untreated (A–C), or treated overnight with function blocking antibodies recognizing α3 integrin (D-F) or α2 integrin (G–I). Cells were fixed and stained for actin (magenta). Antibodies used were A3-IIF5 (anti-α3) and A2-IIE10 (anti-α2).
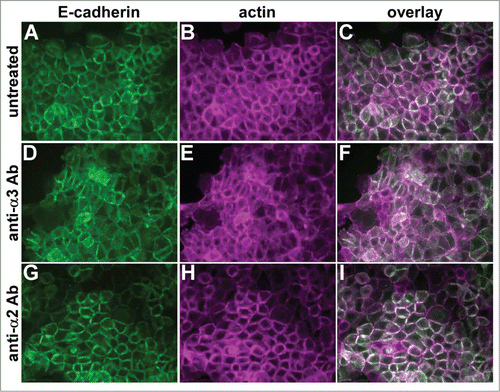
Figure 5. Laminin-332 is required for the maintenance of organized cell junctions. The laminin-α3 subunit was silenced in A431 cells with 2 different shRNA constructs. (A-F) Parental cells and laminin-α3 silenced cells were extracted with Triton X-100 and the remaining extracellular matrix was stained for the α3 or β3 subunit of LM-332. (G-I) A431 parental and laminin-α3-silenced cells expressing E-cadherin-GFP (green) were fixed and photographed. DAPI-stained nuclei are shown in blue.
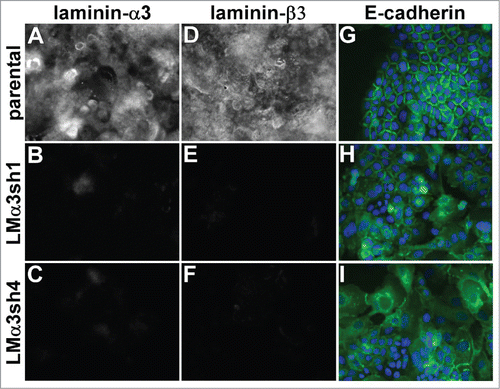
Figure 6. Quantitative analysis of junctional organization. Junctional organization was quantified as described in Experimental Procedures. Representative fields from parental and α3-silenced A431 cells are shown. (A&B) original grayscale images; (C&D) images after Canny-Deriche edge detection filtering; (E&F) edge detection image converted to binary image; (G&H) binary image overlaid with DAPI-stained nuclei (blue). Cells scored as having ≥ 2 organized junctions are numbered in green; those with fewer than 2 organized junctions are numbered in magenta. Cells not included because they were undergoing mitosis at time of fixation are labeled with “m” in gold. (I) The proportion of cells with ≥ 2 organized junctions/cell was quantified for 8 separate fields per cell type is graphed as mean with SEM. CD151-silenced, α3 integrin-silenced, and laminin-α3-silenced cells all showed significantly reduced junctional organization compared to WT parental or α6 integrin-silenced cells, *P ≤ 0.0005 (ANOVA with Tukey post tests).
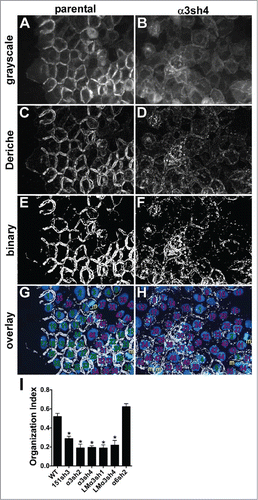
Figure 7. Loss of CD151 can promote invasion and growth in a 3D matrix. (A-H) Parental, CD151, α3, and α6 integrin-silenced cell spheroids were embedded in 3D collagen and photographed immediately (Day 0) and 2 d later (Day 2). (I-L) Parental and CD151-silenced cell spheroids were embedded in 3D collagen and grown 2 d in the presence of 1 µg/ml cell permeable C3 transferase to inhibit Rho activity. (M) Quantification of spheroid size on Day 2, plotted as fold change from size on Day 0. Bars indicate mean ± SEM for 6–12 spheroids per cell type. CD151sh3 spheroids were significantly larger and α3sh4 spheroids were significantly smaller than parental spheroids, *P < 0 .0001, and CD151sh3 spheroids treated with C3 transferase were significantly smaller than untreated CD151sh3 spheroids, #P < 0 .0001. ANOVA with Tukey post-tests. (N&O) Parental and CD151-silenced spheroids were embedded in 3D collagen and cultured for 12 d (P) Spheroids cultured for 12 d in 3D collagen were excised and relative cell number was determined by WST assay after digestion with collagenase type II. Bars indicate mean ± SEM for 12 spheroids per cell type. CD151sh3 spheroids had grown significantly larger, *P < 0.0001, unpaired t test.
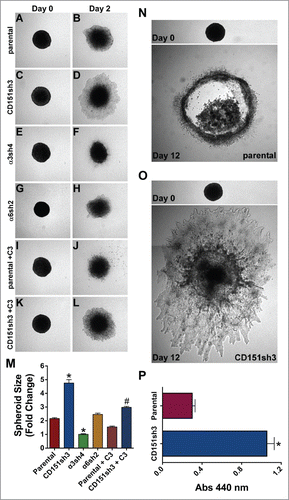
Figure 8. Enhanced invasion of CD151-silenced cells depends on α3β1 integrin. CD151sh3 cell spheroids were embedded in 3D collagen in the absence (A&B) or presence (C&D) of 10 µg/ml A3-IIF5 anti-α3 integrin function blocking antibody, and photographed on Day 1 and Day 4. (E-H) Parental cell spheroids were embedded in collagen with or without A3-IIF5 antibody, as for the CD151sh3 spheroids in (A-D). (I) Quantification of spheroid size on Day 4 plotted as fold change from Day 1. The untreated CD151sh3 cell spheroids were significantly larger than either parental cell spheroids or antibody-treated CD151sh3 cell spheroids, *P<0 .0001, ANOVA with Tukey post-tests.
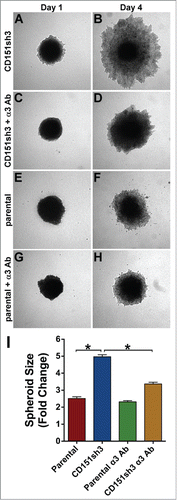
Figure 9. Loss of CD151 can promote a more invasive and rapidly growing tumor phenotype in vivo. (A) CD151-silenced cell spheroids (left) and parental spheroids (right) were recovered 6 d after intradermal implantation, sectioned, and stained with hematoxylin and eosin (H&E). Tumors (labeled “t”) are surrounded by lightly stained stromal cells. Fat and muscle are visible in some sections. Silhouettes of CD151-silenced and parental tumor sections are displayed below the H&E panels, along with the numerical roundness of each section. The more tortuous the perimeter, the lower the roundness value. The mean roundness of the CD151-silenced spheroids (0.27 ± 0.01) was significantly less than the mean roundness of the parental spheroids (0.84 ± 0.07), n = 3 spheroids/cell type, P = 0.0017, unpaired t test. (B) In vivo growth of parental and CD151-silenced spheroids was monitored by bioluminescence imaging. By day 20, CD151sh3 spheroids were significantly larger than parental spheroids, *P = 0.0188, unpaired t test, n = 3 spheroids/cell type. (C) H&E staining of day 20 parental and CD151-silenced spheroids. Tumors (“t”) and epidermis (“e”) are labeled.
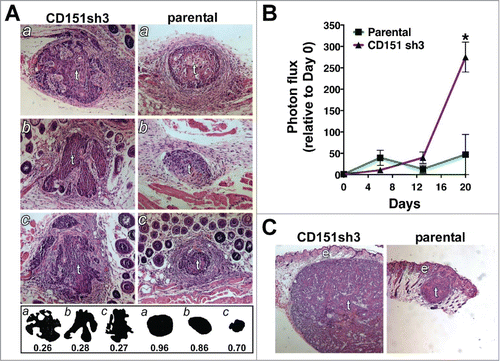
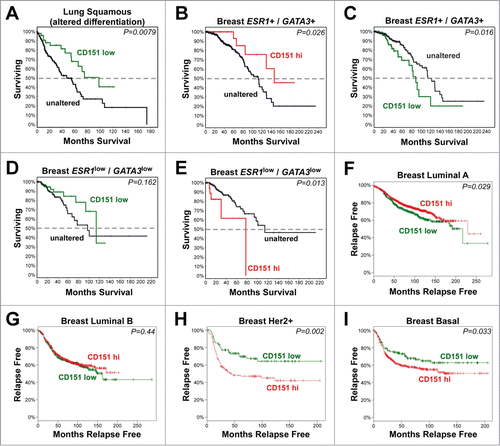
Figure 10. The relationship of CD151 expression to clinical outcomes in human cancers. (A-E) Analysis of CD151 expression by RNAseq in TCGA Lung Squamous Cell Carcinoma and Invasive Breast Carcinoma databases. Survival curves are shown for CD151-low cases (Z-score < −1; shown in green) or CD151-high cases (Z-score > 1; shown in red) compared to cases in which CD151 expression was unaltered (shown in black). (A) Reduced CD151 expression was associated with increased overall survival in lung squamous cell carcinomas harboring changes in genes that regulate squamous cell differentiation. (B&C) In less aggressive ESR1+/GATA3+ breast cancers (in which estrogen receptor α (ESR1) or GATA3 were not reduced; see Fig. S8), reduced CD151 expression was associated with reduced survival, while increased CD151 expression was associated with increased survival. (D&E) In the more aggressive ESR1low/GATA3low breast cancer cases, CD151-low cases showed a trend toward increased survival, while CD151-high cases showed reduced overall survival. (F-I) Analysis of CD151 expression in different breast cancer molecular subtypes using KM-plotter to query Affymetrix microarray data. (F) In luminal A breast cancers, CD151-high cases (red) showed increased relapse-free survival compared to CD151-low cases (green). (G) In luminal B breast cancers, no association between CD151 expression and relapse-free survival was observed. (H&I) in Her2+ and basal-like breast cancers, CD151-high cases showed reduced relapse-free survival. In all panels, P values were calculated by the logrank test. More detailed information about the number of cases represented in each panel is found in Table S1.