
Figures & data
Figure 1. Hypoxia induces cell death in glioma cells over a 72 hour time course. Glioma cell lines A) U87 and B) U373 were placed under hypoxia for a 72 hour time course. The amount of cell death was determined by trypan blue exclusion assay. Error bars represent standard error of 3 independent experiments and * represents a statistically significant difference between cell death levels in normoxia and hypoxia.
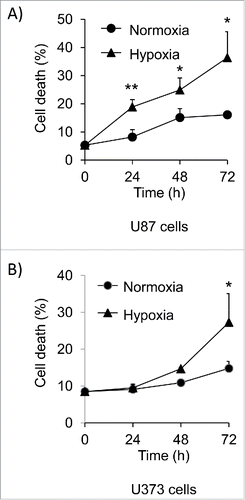
Figure 2. Mcl-1 levels decrease during hypoxia in glioma cells. (A) Western blot analysis of U87 cells was performed following a 72 hour time course under hypoxia. Mcl-1 and Bcl-xL protein levels were determined and actin was used as a loading control. (B) Relative levels of Mcl-1 protein expression confirmed by densitometry. Data represents mean of 3 independent experiments ± standard error. * represents statistically significant differences. (C) U87, U251 and U373 glioma cell lines were placed under hypoxia for a 48 hour time course. The cells were lysed and western blotted for Mcl-1. Actin was used as a loading control.
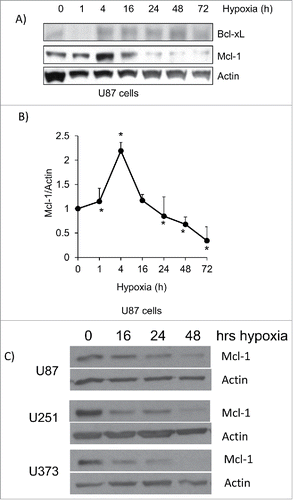
Figure 3. Mcl-1 contributes to cell survival under hypoxia. (A) U87 cells were transfected with siRNA control and siRNA against Mcl-1. The cells were then lysed and western blotted for Mcl-1. Actin was used as a loading control. (B) Cells were placed under hypoxia for 4 and 24 hours where N=normoxia and H=hypoxia. Amount of cell death was determined in cells transfected with siRNA control (siCon) and siRNA against Mcl-1 (siMcl-1) using a trypan blue exclusion assay. (C) HEK293 cells were transfected with expression vector alone or with cDNA for Mcl-1. The cells were lysed and western blotted for Mcl-1. Actin was used as a loading control. (D) The transfected cells were placed under hypoxia for 72 hours where N = normoxia and H = hypoxia. The amount of cell death was determined by trypan blue exclusion assay. * represents statistically significant differences between normoxia and hypoxia. Error bars represent standard error of 3 independent experiments.
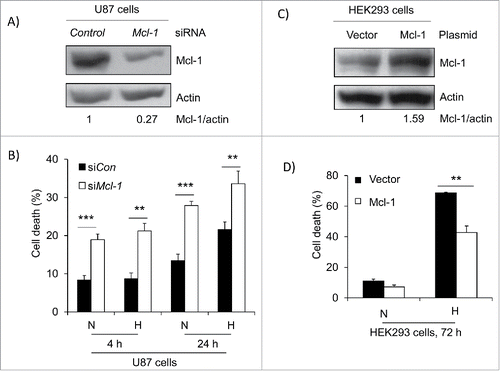
Figure 4. E3 ligase FBW7 expression is increased in hypoxia and contributes to Mcl-1 degradation. (A) U87 cells were placed under hypoxia for a 72 hour time course. Cells were lysed and western blotted for FBW7 expression. Actin was used as a loading control. (B) Densitometry was performed on FBW7 and actin to determine the fold increase in expression. (C) U87 cells were transfected with control siRNA (siCon) and siRNA against FBW7 (siFBW7). Cells were placed under hypoxia for 48 hours and lysed. Lysate was western blotted for FBW7 and Mcl-1 levels and actin was used as a loading control. (D) The amount of cell death was determine by trypan blue exclusion assay where N=normoxia and H=hypoxia at 72 hours. * represents statistically significant differences between normoxia and hypoxia. Error bars represent standard error of 3 independent experiments.
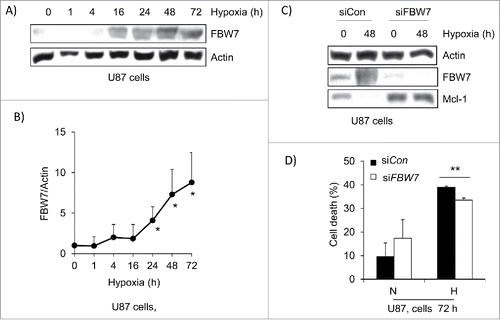
Figure 5. EGFR activation increased Mcl-1 under hypoxia and protects against hypoxia induced cell death. (A) HEK293 cells were treated with EGF (1μg/ml) and placed under hypoxia for 48 hours. The amount of cell death was determined by trypan blue exclusion assay. Error bars represent standard error of 3 independent experiments. (B) Cells in the presence or absence of EGF were placed under hypoxia for 24 hours. The cells were lysed and western blotted for Mcl-1 expression. Actin was used as a loading control. (C) U87 cells were transfected with siRNA control (siCon) and siRNA against EGFR (siEGFR) and placed under hypoxia for 4 hours. The cells were lysed and western blotted for EGFR, tyrosine phosphorylated EGFR (Y1068) and Mcl-1. Actin was used as a loading control. (D) U87 cells were placed under hypoxia for 24 hours after transfection with siCon or siEGFR. Cell death was determined by trypan blue exclusion assay. Normoxia is represented by N and hypoxia is represented by H. (E) U87 cells were treated with gefitinib (40mM) and incubated for 4 hours under hypoxia. The cells were then lysed and western blotted for EGFR, tyrosine phosphorylated EGFR and Mcl-1 expression. Actin was a loading control. (F) Cell death was determine by trypan blue exclusion assay where N = nomoxia and H = hypoxia. Error bars represent standard error of 3 independent experiments. * represents statistically significant differences (p < 0.05).
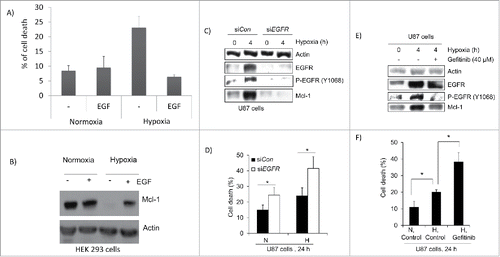
Figure 6. Astrocytes and murine embryonic fibroblasts lacking BNIP3 are resistant to hypoxia induced cell death. (A) Wild type and BNIP3 knockout astrocytes were placed under hypoxia for 24 hours. Cells were lysed and western blotted for BNIP3 expression. (B) Wild type and BNIP3 knockout murine embryonic fibroblasts (MEFs) cells were placed under hypoxia for a 48 hour time course. Cells were lysed and western blotted for BNIP3. Actin was used as a loading control. (C) MEF cells were placed under hypoxia for 24 hours. Cells were visualized under a phase contrast microscopy. MEF cells (D) and astrocytes (E) were placed under hypoxia for a 72 hour time course and the amount of cell death was determined by trypan blue exclusion assay. Error bars represent standard error of 3 independent experiments.
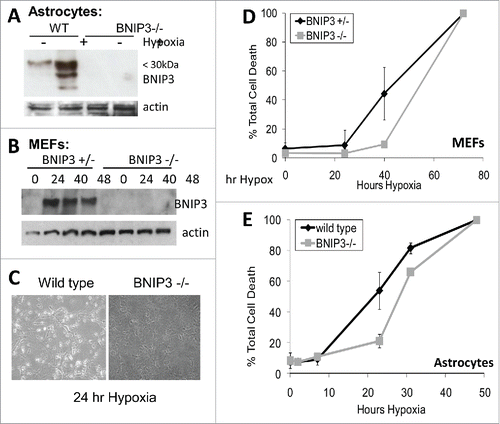
Figure 7. Knockdown of BNIP3 blocks hypoxia induced cell death. (A) U87 cells were placed under hypoxia for a 72 hour time course. The cells were lysed and western blotted for HIF-1α, and BNIP3. (B) Using densitometry, the fold increase in BNIP3 and HIF-1α was determined. (C) U87 cells were transfected by control siRNA (siCon) and siRNA against BNIP3 (siBNIP3). Cells were placed under hypoxia for 16 hours and lysed. The lysate was western blotted for BNIP3 and actin. (D) U87 cells transfected with siCon and siBNIP3 were placed under hypoxia for 72 hours. The amount of cell death was determined by trypan blue exclusion assay. Normoxia is represented by N and hypoxia is represented by H. * represents statistically significant differences (p < 0.05).
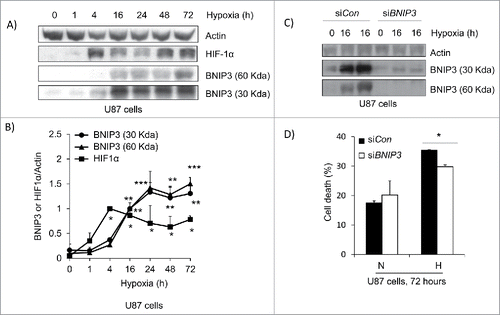
Figure 8. Mcl-1 blocks BNIP3 induced cell death and ROS production. (A) HEK293 cells were transfected with expression vectors for BNIP3 or Mcl-1. The percentage of cell death was determined by trypan blue exclusion assay. Error bars represent standard error. (B) Cells were transfected with expression vector for BNIP3 and treated with EGF. The percentage of cell death was determined by trypan blue exclusion assay. Error bars represent standard error. (C) HEK293 cells were transfected as above and levels of ROS production determined by flow cytometer. Error bars represent standard error. ** represents statistical significance between BNIP3 expression alone and in combination with Mcl-1 (p < 0.05).
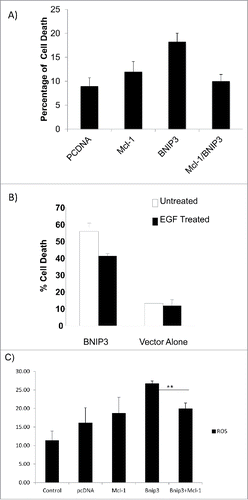
Figure 9. Mcl-1 and BNIP3 colocalize in glioma cells, GBM tumors and EGFRvIII expressing tumors. (A) U373 cells were placed under hypoxia for 16 hours. Cells were immunostained for Mcl-1, and BNIP3 and DNA was stained with DAPI. Cells were visualized using a confocal microscope. (B) GBM tumors were histochemical stain for BNIP3 and Mcl-1. Staining without primary antibodies was used as negative control. Tumor 1 represents a GBM tumor with high expression for both Mcl-1 and BNIP3. Tumor 2 represents a GBM tumor with low expression for both Mcl-1 and BNIP3. * represents statistically significant differences (p < 0.05).
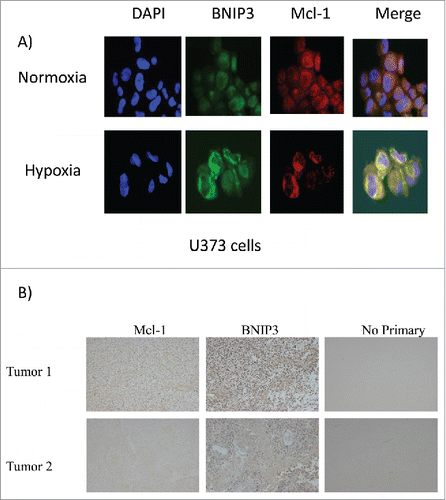
Table 1. Expression levels for Mcl-1 and BNIP3 in GBM tumors