
Figures & data
Table 1. Demographics of epithelioid mesothelioma cases by tumor site and data source.
Figure 1. Overview of copy number alterations (CNAs) in epithelioid peritoneal MM. Peaks represented in blue to the right of the chromosome are gains, while peaks in red to the left depict losses. Areas with peaks in over 33% of cases are indicated by an asterisk (except for a broad area in chromosome 14 with a bracket), and labeled with a Cancer Census gene if present in that region.
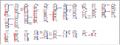
Figure 2. Frequency of CNAs in peritoneal and pleural MM. DNA copy number frequency output from Nexus Biodiscovery was overlapped to shows relative rates of alterations by tumor site. Regions in red and blue overlap between both conditions, while region in light blue and pink reflect higher frequency of gain or loss, respectively, in the pleural site. Areas in gray reflect regions of increased frequency of gain or loss in peritoneal site, identified as gains to the right and losses to the left of the chromosomal ideogram. Regions of increased frequency in peritoneal disease with Cancer Census genes from are marked by an asterisk.
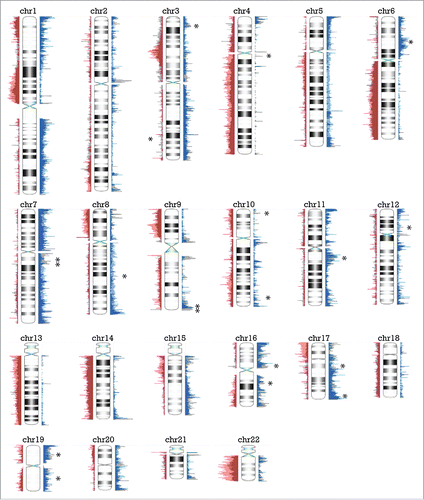
Table 2. Cancer related genes within regions of differential gains and losses in epithelioid malignant mesothelioma (MM), by tumor site.
Figure 3. Significant regions of gains and losses in pleural and peritoneal MM. Frequency data of CNAs for the 41 pleural and 48 peritoneal epithelioid MMs are shown, with regions significant to p <0.01 and a difference threshold greater than 33% flagged in the column labeled Sig (.01). Red segments in the significance bar depict regions of significantly different incidence of chromosomal losses between the 2 disease sites; blue segments equal significantly different sites of chromosome gains.
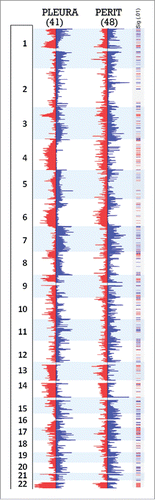
Figure 4. Significant regions of gains (blue) and losses (red) in radiation- associated versus asbestos-associated epithelioid MM. CNAs between 9 post-radiation MM cases and 32 post-asbestos cases are displayed with regions significant to p <0.05 and a difference threshold greater than 33% flagged in the upper row labeled Sig .05. Note the elevated proportion of radiation-exposed MMs with extended regions of chromosomal gain in 1q, 3q and 5p relative to asbestos-exposed tumors. Additionally, there is an elevated proportion of asbestos-associated MMs with extended or multiple regions of chromosomal loss in 6q, proximal 14q and 22q relative to that observed in post-radiation cases of MM.
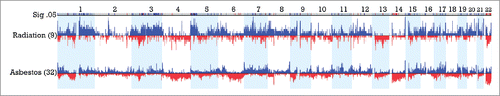
Table 3. Cancer related genes within regions of differential gains and losses in epithelioid MM, by radiation and asbestos causality.