1,159
Views
19
CrossRef citations to date
0
Altmetric
Research Paper

Diagnostic and prognostic significance of serum apolipoprotein C-I in triple-negative breast cancer based on mass spectrometry

, , , , , , , , , , , , , , , , & show all
Pages 635-647 | Received 21 Oct 2015, Accepted 14 Feb 2016, Published online: 15 Jun 2016

Figures & data

Figure 1. Follow-up of all enrolled triple-negative breast cancer(TNBC) and non-triple-negative breast cancer(NTNBC) patients from the mining and blind testing sets and representative expression map from surface-enhanced laser desorption/ionization time-of-flight mass spectrometry(SELDI-TOF-MS) analysis of sera from control, NTNBC and TNBC patients in the mining set. (A) Kaplan-Meier survival curves for NTNBC and TNBC patients from the mining and blind testing sets. (B) Graph of Hazard Function analysis between NTNBC and TNBC cases in the mining and blind testing sets. (C) The peak at 7785 Da was significantly elevated in TNBC patient sera, compared with NTNBC and control sera in the mining set (p < 0.0001). (D) Representative expression of the peak at 7785 Da (left panel,arrow) and gel views(right panel, arrow)from control, NTNBC and TNBC patient sera in the mining set.****p ≤ 0.0001.
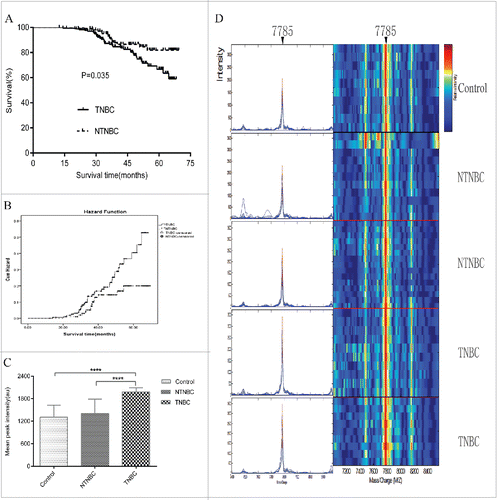
Figure 1. Follow-up of all enrolled triple-negative breast cancer(TNBC) and non-triple-negative breast cancer(NTNBC) patients from the mining and blind testing sets and representative expression map from surface-enhanced laser desorption/ionization time-of-flight mass spectrometry(SELDI-TOF-MS) analysis of sera from control, NTNBC and TNBC patients in the mining set. (A) Kaplan-Meier survival curves for NTNBC and TNBC patients from the mining and blind testing sets. (B) Graph of Hazard Function analysis between NTNBC and TNBC cases in the mining and blind testing sets. (C) The peak at 7785 Da was significantly elevated in TNBC patient sera, compared with NTNBC and control sera in the mining set (p < 0.0001). (D) Representative expression of the peak at 7785 Da (left panel,arrow) and gel views(right panel, arrow)from control, NTNBC and TNBC patient sera in the mining set.****p ≤ 0.0001.

Figure 2. Typical expression map of SELDI-TOF-MS analysis of sera from different stages of TNBC and NTNBC. (A)Typical expression of the 7785 Da peak (left panel, arrow) and gel views (right panel, arrow) at different stages of TNBC (TNBC-I: patient with stage I TNBC; TNBC-II: patient with stage II TNBC; TNBC-III: patient with stage III TNBC; TNBC-IV: patient with stage IV TNBC). (B)The 7785 Da protein peak progressively increased with clinical stage in TNBC(p< 0.0001). (C) Typical expression of the 7785 Da protein (left panel, arrow) and gel views (right panel, arrow) at different stages of NTNBC (NTNBC-I: patient with stage I NTNBC; NTNBC-II: patient with stage II NTNBC; NTNBC-III: patient with stage III NTNBC; NTNBC-IV: patient with stage IV NTNBC). (D) The 7785 Da peak displayed no significant changes with increasing clinical stage in NTNBC(p = 0.052).** p ≤ 0.01,****p ≤ 0.0001.
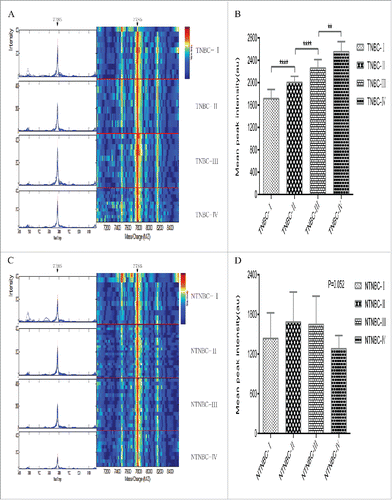
Figure 2. Typical expression map of SELDI-TOF-MS analysis of sera from different stages of TNBC and NTNBC. (A)Typical expression of the 7785 Da peak (left panel, arrow) and gel views (right panel, arrow) at different stages of TNBC (TNBC-I: patient with stage I TNBC; TNBC-II: patient with stage II TNBC; TNBC-III: patient with stage III TNBC; TNBC-IV: patient with stage IV TNBC). (B)The 7785 Da protein peak progressively increased with clinical stage in TNBC(p< 0.0001). (C) Typical expression of the 7785 Da protein (left panel, arrow) and gel views (right panel, arrow) at different stages of NTNBC (NTNBC-I: patient with stage I NTNBC; NTNBC-II: patient with stage II NTNBC; NTNBC-III: patient with stage III NTNBC; NTNBC-IV: patient with stage IV NTNBC). (D) The 7785 Da peak displayed no significant changes with increasing clinical stage in NTNBC(p = 0.052).** p ≤ 0.01,****p ≤ 0.0001.

Table 1. Demographics of triple-negative breast cancer (TNBC) and non-triple-negative breast cancer (NTNBC) patients enrolled in the study.

Table 2. Comparison of protein peak intensities between controls and NTNBC patients in the mining set.

Table 3. Comparison of protein peak intensities between controls and TNBC patients in the mining set.

Table 4. Comparison of protein peak intensities between NTNBC and TNBC patients in the mining set.

Figure 3. Validation, identification and polymerase chain reaction (PCR) confirmation of the peak at 7785 Da. (A) Validation of the peak at 7785 Da in the blind testing set. (B)The intensity of the 7785 Da peak was higher in TNBC patient sera, compared with NTNBC and control sera in the blind testing set. (C)Representative matrix-assisted laser desorption/ionization time-of-flight/time-of-flight mass spectrometry(MALDI-TOF/TOF MS) map of peptide segments obtained after enzymatic digestion of protein and peptide segments with m/z of 7785 Da. (D) Ethidium bromide-stained semi-quantitative reverse transcription-PCR(RT-PCR) products of apoC-I mRNA in control, NTNBC and TNBC sera.Lanes 1–2: control; lanes 3–4: NTNBC; lanes 5–6: TNBC; ApoC-I gene expression (121bp) was analyzed via semi-quantitative RT-PCR, with β-actin (100 bp) as the internal control. (E)Representative quantitativereal-time PCR amplification plot of apoC-I in different serum samples; Rn, normalized report fluorescence. ((F) and G) Representative melting curves of apoC-I and β-actin during quantitative real-time PCR. (H) Relative apoC-I expression normalized to β-actin in different serum samples.****p ≤ 0.0001.
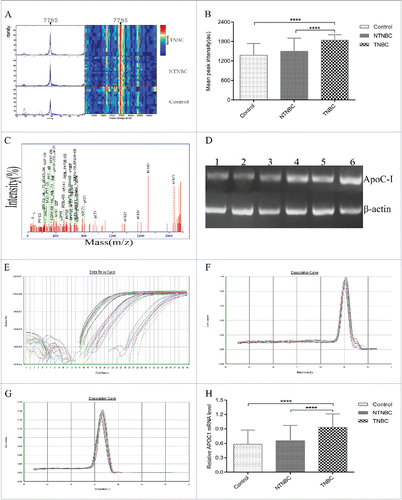
Figure 3. Validation, identification and polymerase chain reaction (PCR) confirmation of the peak at 7785 Da. (A) Validation of the peak at 7785 Da in the blind testing set. (B)The intensity of the 7785 Da peak was higher in TNBC patient sera, compared with NTNBC and control sera in the blind testing set. (C)Representative matrix-assisted laser desorption/ionization time-of-flight/time-of-flight mass spectrometry(MALDI-TOF/TOF MS) map of peptide segments obtained after enzymatic digestion of protein and peptide segments with m/z of 7785 Da. (D) Ethidium bromide-stained semi-quantitative reverse transcription-PCR(RT-PCR) products of apoC-I mRNA in control, NTNBC and TNBC sera.Lanes 1–2: control; lanes 3–4: NTNBC; lanes 5–6: TNBC; ApoC-I gene expression (121bp) was analyzed via semi-quantitative RT-PCR, with β-actin (100 bp) as the internal control. (E)Representative quantitativereal-time PCR amplification plot of apoC-I in different serum samples; Rn, normalized report fluorescence. ((F) and G) Representative melting curves of apoC-I and β-actin during quantitative real-time PCR. (H) Relative apoC-I expression normalized to β-actin in different serum samples.****p ≤ 0.0001.

Table 5. Peptide sequences obtained after enzymatic digestion of protein and peptide segments with m/z of 7785 Da. Peptide sequences identified using the NCBI database are in bold.

Figure 4. Immunoassay-based confirmation of the diagnostic and prognostic value of the candidate protein biomarker based on Kaplan-Meier Survival and Hazard Function curve analyses. (A) Qualitative enzyme-linked immunosorbent assay (ELISA) confirmed SELDI-TOF and MALDI-TOF/TOF MS findings on the apoC-I protein biomarker in 50 control, 45 NTNBC and 75 TNBC samples. Expression of the apoC-I protein was significantly elevated in TNBC patient sera, compared with NTNBC and control sera. OD ratios of apoC-I following normalization to a selected TNBC serum source were calculated and used as the vertical scale. (B) Representative western blot analysis of the apoC-I protein biomarker in the same serum samples. Lanes 1–2: control; Lanes 3–4: NTNBC; Lanes 5–6: TNBC. β-Actin was used as a reference. (C) Grayscale scanning of protein gel blot bands, in which the ratio of the grayscale values of apoC-I to β-actin was used as the analyzed scale, revealed a similar trend to ELISA results. (D) Diagnostic value of apoC-I, determined using ROC curve, compared with NTNBC. (E) Kaplan-Meier survival curve for the 7785 Da peak in NTNBC patients divided into apoC-I-lower and apoC-I-higher groups from the testing set. (F) Graph of Hazard Function analysis between the apoC-I-lower and apoC-I-higher groups of NTNBC patients from the testing set. (G) Kaplan-Meier survival curve for the 7785 Da peak in TNBC patients divided into apoC-I-lower and apoC-I-higher groups from the testing set. (H) Graph of Hazard Function analysis between the apoC-I-lower and apoC-I-higher groups of TNBC patients from the testing set, supporting increased apoC-I peak intensity as a risk factor for poor prognosis.
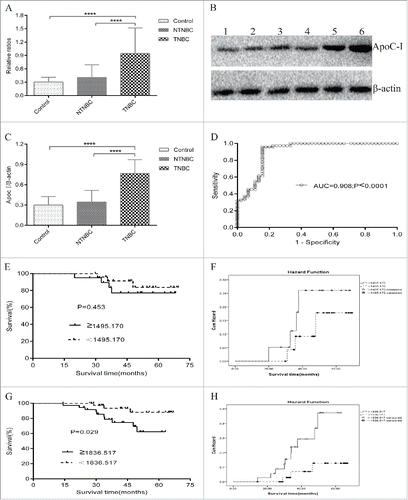
Figure 4. Immunoassay-based confirmation of the diagnostic and prognostic value of the candidate protein biomarker based on Kaplan-Meier Survival and Hazard Function curve analyses. (A) Qualitative enzyme-linked immunosorbent assay (ELISA) confirmed SELDI-TOF and MALDI-TOF/TOF MS findings on the apoC-I protein biomarker in 50 control, 45 NTNBC and 75 TNBC samples. Expression of the apoC-I protein was significantly elevated in TNBC patient sera, compared with NTNBC and control sera. OD ratios of apoC-I following normalization to a selected TNBC serum source were calculated and used as the vertical scale. (B) Representative western blot analysis of the apoC-I protein biomarker in the same serum samples. Lanes 1–2: control; Lanes 3–4: NTNBC; Lanes 5–6: TNBC. β-Actin was used as a reference. (C) Grayscale scanning of protein gel blot bands, in which the ratio of the grayscale values of apoC-I to β-actin was used as the analyzed scale, revealed a similar trend to ELISA results. (D) Diagnostic value of apoC-I, determined using ROC curve, compared with NTNBC. (E) Kaplan-Meier survival curve for the 7785 Da peak in NTNBC patients divided into apoC-I-lower and apoC-I-higher groups from the testing set. (F) Graph of Hazard Function analysis between the apoC-I-lower and apoC-I-higher groups of NTNBC patients from the testing set. (G) Kaplan-Meier survival curve for the 7785 Da peak in TNBC patients divided into apoC-I-lower and apoC-I-higher groups from the testing set. (H) Graph of Hazard Function analysis between the apoC-I-lower and apoC-I-higher groups of TNBC patients from the testing set, supporting increased apoC-I peak intensity as a risk factor for poor prognosis.
Supplemental material

Supplemental_Informations.doc

Download MS Word (55 KB)

Reprints and Corporate Permissions

Please note: Selecting permissions does not provide access to the full text of the article, please see our help page How do I view content?

To request a reprint or corporate permissions for this article, please click on the relevant link below:

Academic Permissions

Please note: Selecting permissions does not provide access to the full text of the article, please see our help page How do I view content?

Obtain permissions instantly via Rightslink by clicking on the button below:

If you are unable to obtain permissions via Rightslink, please complete and submit this Permissions form. For more information, please visit our Permissions help page.