
Figures & data
Table 1. Descriptive characteristics of the study participants (N:86).
Table 2. Pathologic complete response(pCR) in the overall study population and in subgroups defined by participant- and disease-related features (N:19 pCR out of 86 study participants).
Figure 1. Overall survival (OS) by subgroups defined upon BMI, i.e., BMI: <26 and BMI≥26.
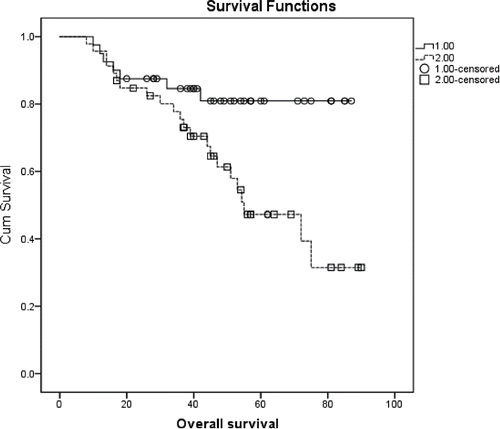
Figure 2. Overall survival (OS) by subgroups defined upon intrinsic molecular subtype (IMS).
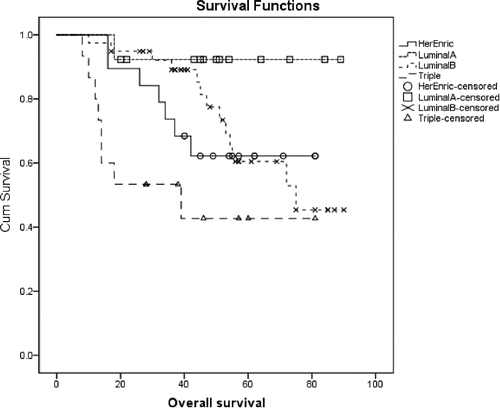
Figure 3. Overall survival (OS) by subgroups defined upon adjuvant radiotherapy (RT).
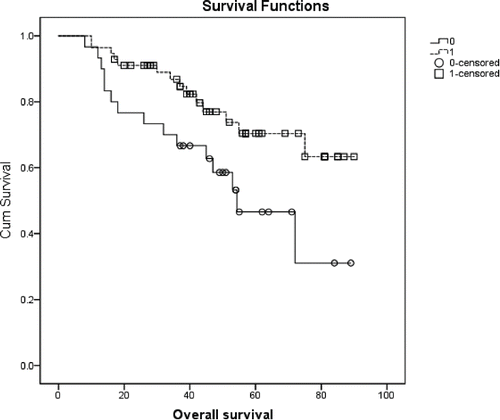
Table 3. Cox proportional hazards models of factors associated with Overall Survival (N:86).
Supplemental material