
Figures & data
Figure 1. Giant hepatic adenoma of the sister. (A) CT scan; clockwise from upper-left: Unenhanced scan, arterial phase of contrast enhanced scan, delayed phase of contrast enhanced scan, portal phase of contrast enhanced scan. (B) In situ hepatic adenoma. (C) View of resected hepatic adenoma. (D) Histology of resected hepatic adenoma.
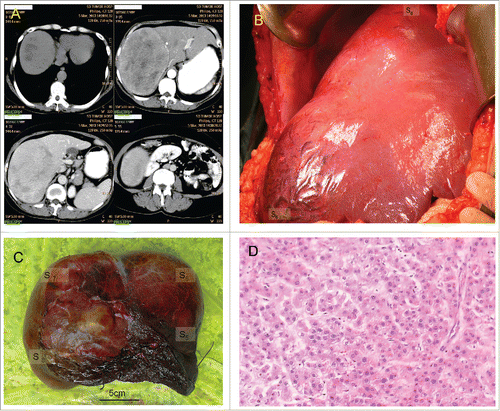
Figure 2. Hepatic adenoma of the brother. (A) Magnetic Resonance imaging; clockwise from upper-left: T1-weighted image, T2-weighted image, fat suppressed image, diffusion weighted image. (B) In situ hepatic adenoma. (C) View of resected hepatic adenoma. (D) Histology of resected hepatic adenoma.
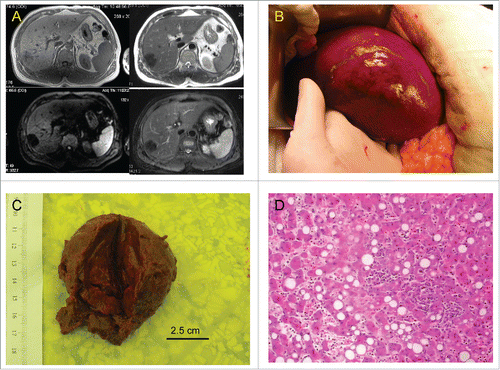
Figure 3. Subtype classification by immunohistochemical analysis. (A) The brother's HA; (B) The sister's HA. From upper panels to lower panels: LFABP, β-catenin, CRP and GS. All original magnifications are 100×; the magnification of the insets in β-catenin is 200× to show the sub-cellular distribution of the positive staining, and the magnification of the insets in GS is 40× to show the homogeneous or heterogeneous distribution of the positive staining.
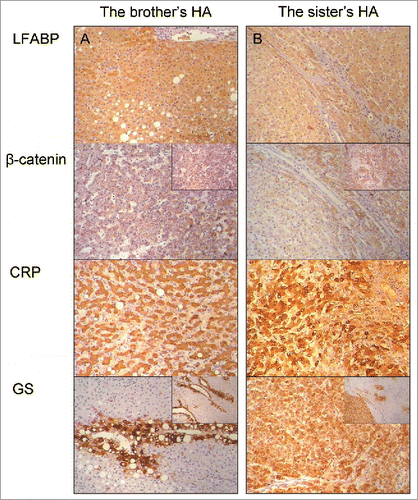
Table 1. Phenotypic and molecular characteristics of four subgroups of hepatic adenoma