1,842
Views
20
CrossRef citations to date
0
Altmetric
Research Paper

Suppression of pancreatic ductal adenocarcinoma growth by intratumoral delivery of attenuated Salmonella typhimurium using a dual fluorescent live tracking system

, , , , , , , & show all
Pages 732-740 | Received 27 Jan 2016, Accepted 08 Apr 2016, Published online: 20 May 2016

Figures & data

Figure 1. Characterization of VNP20009-luc in vitro. (A) VNP20009-luc cells were diluted to obtain numbers ranging from 50 to 1 × 10⁸ cells, plated in duplicate wells, and imaged with IVIS Spectrum Imaging System. Wells containing VNP20009 served as controls. Dotted circles indicated the wells with bacteria. (B) Correlation between the VNP20009-luc counts and bioluminescence (r2 = 0.99). VNP and VNP-luc are abbreviations for VNP20009 and VNP20009-luc.
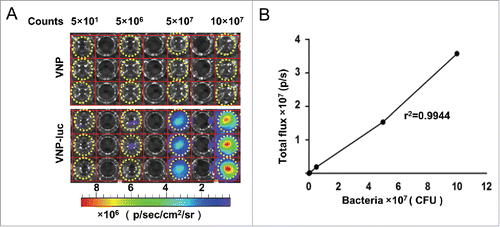
Figure 1. Characterization of VNP20009-luc in vitro. (A) VNP20009-luc cells were diluted to obtain numbers ranging from 50 to 1 × 10⁸ cells, plated in duplicate wells, and imaged with IVIS Spectrum Imaging System. Wells containing VNP20009 served as controls. Dotted circles indicated the wells with bacteria. (B) Correlation between the VNP20009-luc counts and bioluminescence (r2 = 0.99). VNP and VNP-luc are abbreviations for VNP20009 and VNP20009-luc.

Figure 2. Characterization of mKate2-expressing CFPAC-1 cells in vitro and in vivo. (A, B) The mKate2-expressing CFPAC-1 cells were plated at different densities (500–5,000 cells) in 96-well plates, and fluorescence signals were measured with IVIS Spectrum Imaging System (r2 = 0.97), dotted circles indicated the wells with CFPAC-1-mKate-2 cells. (C) Cell viability was analyzed by CCK8 assay after the CFPAC-1 and CFPAC-1-mKate2 cells were co-cultured with VNP20009 or VNP200009-luc for 48 h, ***P < 0.001. (D) The growth rate of subcutaneous tumors of the parental CFPAC-1 and mKate2-expressing cells were measured. Bars, mean ± SEM. (E) The mKate2-expressing CFPAC-1 cells were implanted in nude mice and the mKate2 fluorescent signal was measured on day 15, 25 and 33 after injection. Representative images are shown. (F) The tumor volumes and the corresponding total radiant efficiency were measured. Bars, mean ± SEM. VNP and VNP-luc are abbreviations for VNP20009 and VNP20009-luc.
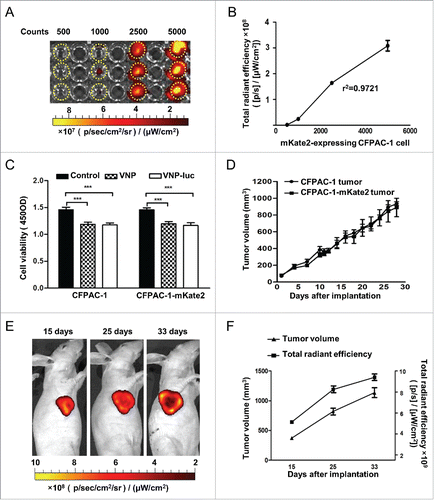
Figure 2. Characterization of mKate2-expressing CFPAC-1 cells in vitro and in vivo. (A, B) The mKate2-expressing CFPAC-1 cells were plated at different densities (500–5,000 cells) in 96-well plates, and fluorescence signals were measured with IVIS Spectrum Imaging System (r2 = 0.97), dotted circles indicated the wells with CFPAC-1-mKate-2 cells. (C) Cell viability was analyzed by CCK8 assay after the CFPAC-1 and CFPAC-1-mKate2 cells were co-cultured with VNP20009 or VNP200009-luc for 48 h, ***P < 0.001. (D) The growth rate of subcutaneous tumors of the parental CFPAC-1 and mKate2-expressing cells were measured. Bars, mean ± SEM. (E) The mKate2-expressing CFPAC-1 cells were implanted in nude mice and the mKate2 fluorescent signal was measured on day 15, 25 and 33 after injection. Representative images are shown. (F) The tumor volumes and the corresponding total radiant efficiency were measured. Bars, mean ± SEM. VNP and VNP-luc are abbreviations for VNP20009 and VNP20009-luc.

Figure 3. Therapeutic efficacy of VNP20009 against CFPAC-1 xenograft in vivo. (A to C) Mice bearing human pancreatic cancer CFPAC-1 xenograft received a single intratumoral injection of vehicle (PBS) or VNP20009-luc (2 × 10⁴ CFU/mouse, n = 10). (D to F) Mice received a single intratumoral injection of PBS, VNP20009 or VNP20009-luc (2 × 10⁶ cfu/mouse, n = 10). (G to I) Mice received 2 intra-tumoral injections of 2 × 10⁶ cfu/mouse with the first injection delivered when tumor volume reached 60–100 mm3 and the second injection 6 d later (n = 10). (C, F, and I) At the end of the treatment period, tumor tissues were dissected and weighed. *P < 0.05, **P < 0.01, ***P < 0.001. Bars, mean ± SEM. VNP and VNP-luc are abbreviations for VNP20009 and VNP20009-luc.
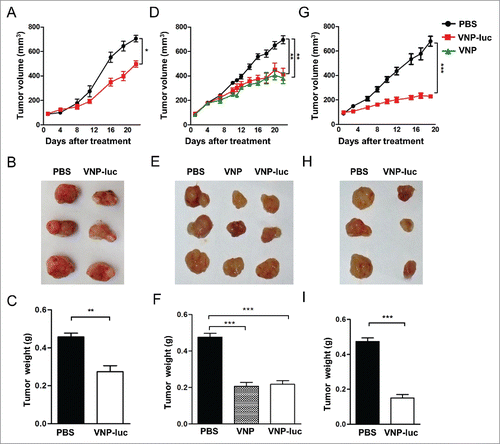
Figure 3. Therapeutic efficacy of VNP20009 against CFPAC-1 xenograft in vivo. (A to C) Mice bearing human pancreatic cancer CFPAC-1 xenograft received a single intratumoral injection of vehicle (PBS) or VNP20009-luc (2 × 10⁴ CFU/mouse, n = 10). (D to F) Mice received a single intratumoral injection of PBS, VNP20009 or VNP20009-luc (2 × 10⁶ cfu/mouse, n = 10). (G to I) Mice received 2 intra-tumoral injections of 2 × 10⁶ cfu/mouse with the first injection delivered when tumor volume reached 60–100 mm3 and the second injection 6 d later (n = 10). (C, F, and I) At the end of the treatment period, tumor tissues were dissected and weighed. *P < 0.05, **P < 0.01, ***P < 0.001. Bars, mean ± SEM. VNP and VNP-luc are abbreviations for VNP20009 and VNP20009-luc.
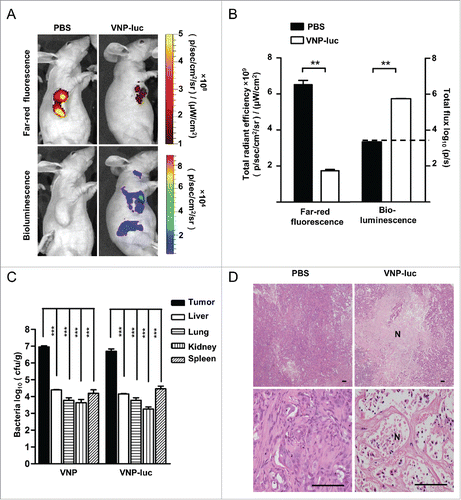
Figure 4. VNP20009 accumulated in CFPAC-1 tumors and caused tumor necrosis. (A) Bioluminescence from VNP20009-luc and far-red fluorescence from tumor cells were visualized with IVIS Spectrum Imaging System on day 12 post a single intratumoral delivery of 2 × 10⁶ CFU/mouse of VNP20009-luc or PBS. Representative mice are shown. Tumor fluorescence = red, bacterial luminescence = rainbow. (B) Quantification of the far-red fluorescence and bacterial bioluminescent signal at tumor site, dash line indicated baseline nonspecific bioluminescent signal (n = 5). (C) Bacterial titer of VNP20009 or VNP20009-luc in tumors, livers, lungs, kidneys and spleens on day 12 post treatment (n = 5), ***P < 0.0001 versus tumor, one-way analysis of variance test followed by Dunnett post hoc. (D). H&E staining of xenograft CFPAC-1 pancreatic tumor on the final day of a single intratumoral injection of 2 × 10⁶ cfu of VNP20009-luc and PBS. Scale bars, 100 µm. N: necrosis, **P < 0.01, ***P < 0.001. Bars, mean ± SEM. VNP and VNP-luc are abbreviations for VNP20009 and VNP20009-luc.

Figure 4. VNP20009 accumulated in CFPAC-1 tumors and caused tumor necrosis. (A) Bioluminescence from VNP20009-luc and far-red fluorescence from tumor cells were visualized with IVIS Spectrum Imaging System on day 12 post a single intratumoral delivery of 2 × 10⁶ CFU/mouse of VNP20009-luc or PBS. Representative mice are shown. Tumor fluorescence = red, bacterial luminescence = rainbow. (B) Quantification of the far-red fluorescence and bacterial bioluminescent signal at tumor site, dash line indicated baseline nonspecific bioluminescent signal (n = 5). (C) Bacterial titer of VNP20009 or VNP20009-luc in tumors, livers, lungs, kidneys and spleens on day 12 post treatment (n = 5), ***P < 0.0001 versus tumor, one-way analysis of variance test followed by Dunnett post hoc. (D). H&E staining of xenograft CFPAC-1 pancreatic tumor on the final day of a single intratumoral injection of 2 × 10⁶ cfu of VNP20009-luc and PBS. Scale bars, 100 µm. N: necrosis, **P < 0.01, ***P < 0.001. Bars, mean ± SEM. VNP and VNP-luc are abbreviations for VNP20009 and VNP20009-luc.

Figure 5. VNP20009 inhibited tumor growth and induced tumor apoptosis in vivo. (A) Representative immunohistochemical microphotographs of Ki67-stained xenograft CFPAC-1 pancreatic tumor sections. Proliferative nuclei were stained brown by Ki67. Scale bars, 50 µm. (B) Quantified data were determined by the number of Ki67-positive cells dividing the total number of cells in 5 randomly selected fields under light microscopy. (C) Western bolt analyses of Bax and caspase-3 in the tumors at the end of treatment of a single intratumoral injection of 2 × 10⁶ cfu of VNP20009-luc or PBS. The expression of (D) Bax and (E) Cleaved caspase-3 were quantified and compared. n = 5 mice per group. **P < 0.01, ***P < 0.001. Bars, mean ± SEM. VNP-luc is abbreviation for VNP20009-luc.
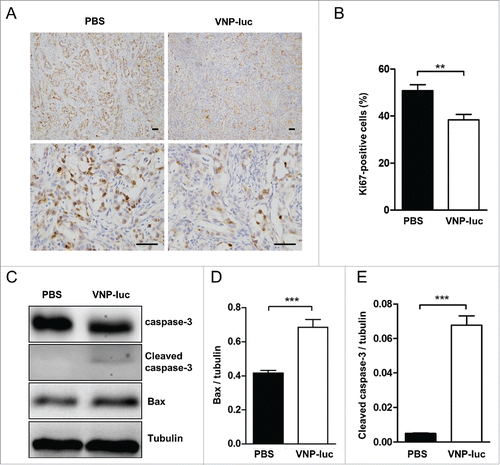
Figure 5. VNP20009 inhibited tumor growth and induced tumor apoptosis in vivo. (A) Representative immunohistochemical microphotographs of Ki67-stained xenograft CFPAC-1 pancreatic tumor sections. Proliferative nuclei were stained brown by Ki67. Scale bars, 50 µm. (B) Quantified data were determined by the number of Ki67-positive cells dividing the total number of cells in 5 randomly selected fields under light microscopy. (C) Western bolt analyses of Bax and caspase-3 in the tumors at the end of treatment of a single intratumoral injection of 2 × 10⁶ cfu of VNP20009-luc or PBS. The expression of (D) Bax and (E) Cleaved caspase-3 were quantified and compared. n = 5 mice per group. **P < 0.01, ***P < 0.001. Bars, mean ± SEM. VNP-luc is abbreviation for VNP20009-luc.