1,809
Views
14
CrossRef citations to date
0
Altmetric
Research Paper

Metuzumab enhanced chemosensitivity and apoptosis in non-small cell lung carcinoma

, , , , , , , , , , , , & show all
Pages 51-62 | Received 02 Jun 2016, Accepted 18 Dec 2016, Published online: 05 Jan 2017

Figures & data

Figure 1. The antitumor efficacy of metuzumab combined with GP, TP or NP in vitro and in vivo. (A) Tumor growth inhibition with metuzumab alone or combined with GP, TP or NP in Balb/c nude mice bearing A549 (left), NCI-H460 (middle) and NCI-H520 (right) human lung cancer cell line xenografts. Data are presented as tumor volume (mm3) in the means ± SD (n = 10). (B) Analysis of cell-growth rate by modified MTT assay. (C) Representative images of metuzumab distribution in nude mice bearing A549, NCI-H460 and NCI-H520 cell xenograft. Each experiment was repeated for at least 3 times.
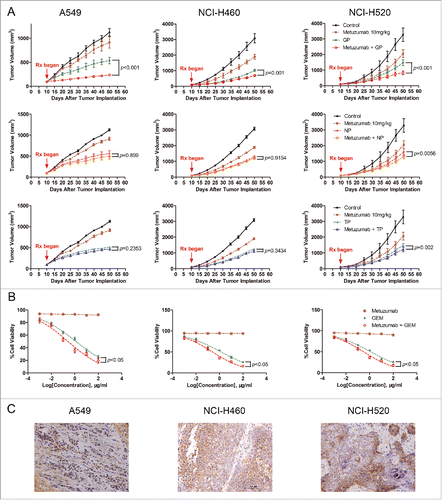
Figure 1. The antitumor efficacy of metuzumab combined with GP, TP or NP in vitro and in vivo. (A) Tumor growth inhibition with metuzumab alone or combined with GP, TP or NP in Balb/c nude mice bearing A549 (left), NCI-H460 (middle) and NCI-H520 (right) human lung cancer cell line xenografts. Data are presented as tumor volume (mm3) in the means ± SD (n = 10). (B) Analysis of cell-growth rate by modified MTT assay. (C) Representative images of metuzumab distribution in nude mice bearing A549, NCI-H460 and NCI-H520 cell xenograft. Each experiment was repeated for at least 3 times.

Table 1. The IRTV of metuzumab, GP, NP and TP alone or combination in xenografts nude mice.

Figure 2. Metuzumab combined with GP represses cell proliferation and induces apoptosis in vivo. (A) Western blot analysis on the level of CD147 expression in A549, NCI-H460 or NCI-H520 cells. β-actin was used as the internal control. The experiments were performed triplicate. Gray-scale value was analyzed by Image J software for 3 times. The numbers indicate relative protein expression normalized to β-actin. (B) FACS analysis was used to examine the level of CD147 expression in A549, NCI-H460 or NCI-H520 cells. (C) Representative images of immunohistochemical staining for Ki-67, TUNEL, Bax and Bcl-2 in nude mice bearing A549 cell xenograft received metuzumab, GP or metuzumab combined with GP treatment. Scale bar in Ki-67, Bax and Bcl-2 represents 50 μm, scale bar in TUNEL represents 20μm. Histogram represents the integrated optical density (IOD) of Ki-67, Bax and Bcl-2 expression and percentage of TUNEL positive nuclei from the studied group. The bars represent each sample performed in triplicate, and the error bars indicate mean ± SD. **p < 0.01. ***p < 0.001.
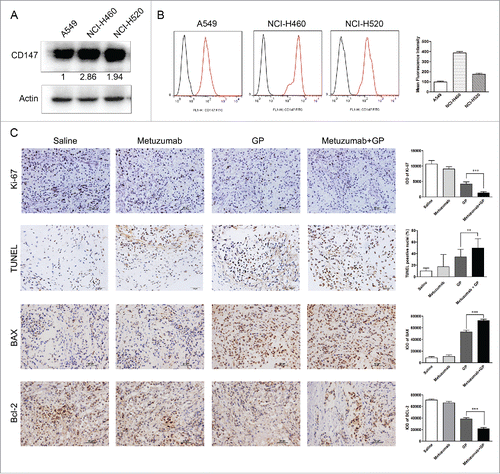
Figure 2. Metuzumab combined with GP represses cell proliferation and induces apoptosis in vivo. (A) Western blot analysis on the level of CD147 expression in A549, NCI-H460 or NCI-H520 cells. β-actin was used as the internal control. The experiments were performed triplicate. Gray-scale value was analyzed by Image J software for 3 times. The numbers indicate relative protein expression normalized to β-actin. (B) FACS analysis was used to examine the level of CD147 expression in A549, NCI-H460 or NCI-H520 cells. (C) Representative images of immunohistochemical staining for Ki-67, TUNEL, Bax and Bcl-2 in nude mice bearing A549 cell xenograft received metuzumab, GP or metuzumab combined with GP treatment. Scale bar in Ki-67, Bax and Bcl-2 represents 50 μm, scale bar in TUNEL represents 20μm. Histogram represents the integrated optical density (IOD) of Ki-67, Bax and Bcl-2 expression and percentage of TUNEL positive nuclei from the studied group. The bars represent each sample performed in triplicate, and the error bars indicate mean ± SD. **p < 0.01. ***p < 0.001.

Figure 3. Combined effect of metuzumab and gemcitabine on cell cycle in A549, NCI-H460 and NCI-H520 cells. (A) Representative cell cycle profiles obtained by FACS analysis from propidium iodide stained A549, NCI-H460 or NCI-H520 cells treated with human IgG1, metuzumab, gemcitabine or metuzumab combined with gemcitabine. X-axis values correspond to DNA content; Y-axis values correspond to the number of events detected. Graph of the percentage of cells within each phase of the cell cycle in A549 (B), NCI-H460 (C) or NCI-H520 (D) cells obtained by FACS analysis. And data are presented as mean ± SD. (E) Western blot analysis on the expression levels of PCNA, cyclin D1 in A549, NCI-H460 or NCI-H520 cells treated with metuzumab or cHAb18, gemcitabine, and metuzumab or cHAb18 combined with gemcitabine for 24 hour. β-actin was used as the internal control. Gray-scale value was analyzed the same as above. The experiments were performed triplicate. The error bars indicate mean ± SD.
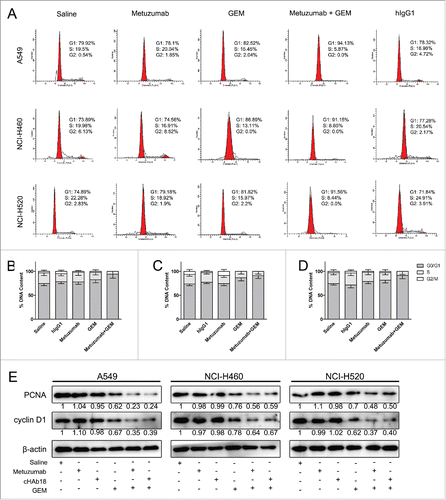
Figure 3. Combined effect of metuzumab and gemcitabine on cell cycle in A549, NCI-H460 and NCI-H520 cells. (A) Representative cell cycle profiles obtained by FACS analysis from propidium iodide stained A549, NCI-H460 or NCI-H520 cells treated with human IgG1, metuzumab, gemcitabine or metuzumab combined with gemcitabine. X-axis values correspond to DNA content; Y-axis values correspond to the number of events detected. Graph of the percentage of cells within each phase of the cell cycle in A549 (B), NCI-H460 (C) or NCI-H520 (D) cells obtained by FACS analysis. And data are presented as mean ± SD. (E) Western blot analysis on the expression levels of PCNA, cyclin D1 in A549, NCI-H460 or NCI-H520 cells treated with metuzumab or cHAb18, gemcitabine, and metuzumab or cHAb18 combined with gemcitabine for 24 hour. β-actin was used as the internal control. Gray-scale value was analyzed the same as above. The experiments were performed triplicate. The error bars indicate mean ± SD.

Figure 4. The effects of metuzumab combined with gemcitabine on apoptosis in A549, NCI-H460 and NCI-H520 cells. (A) Representative apoptosis profiles obtained by FACS analysis from Annexin V and propidium iodide stained in A549, NCI-H460 or NCI-H520 cells treated with human IgG1, metuzumab, gemcitabine or metuzumab combined with gemcitabine. Graphic presentation of data obtained from cell apoptosis analysis of A549 (B), NCI-H460 (C) or NCI-H520 (D) cells. Values are expressed as means (Q2+ Q3) ± SD of at least 3 independent experiments. (E) Western blot analysis on the expression levels of Bax, Bcl-2 and full length caspase-3 in A549, NCI-H460 or NCI-H520 cells treated with metuzumab or cHAb18, gemcitabine and metuzumab or cHAb18 combined with gemcitabine for 24 hour. β-actin was used as the internal control. Gray-scale value was analyzed the same as above. The numbers indicate relative protein expression normalized to β-actin. The bars represent each sample performed in triplicate, and the error bars represent mean ± SD. ***p < 0.001.
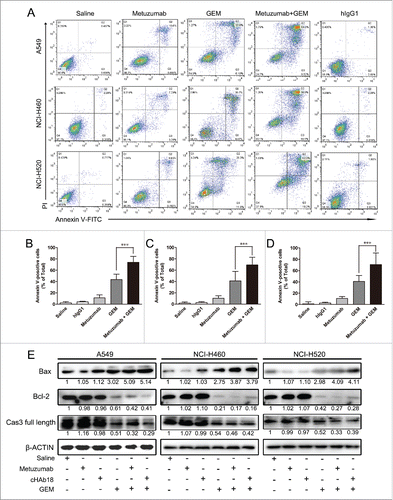
Figure 4. The effects of metuzumab combined with gemcitabine on apoptosis in A549, NCI-H460 and NCI-H520 cells. (A) Representative apoptosis profiles obtained by FACS analysis from Annexin V and propidium iodide stained in A549, NCI-H460 or NCI-H520 cells treated with human IgG1, metuzumab, gemcitabine or metuzumab combined with gemcitabine. Graphic presentation of data obtained from cell apoptosis analysis of A549 (B), NCI-H460 (C) or NCI-H520 (D) cells. Values are expressed as means (Q2+ Q3) ± SD of at least 3 independent experiments. (E) Western blot analysis on the expression levels of Bax, Bcl-2 and full length caspase-3 in A549, NCI-H460 or NCI-H520 cells treated with metuzumab or cHAb18, gemcitabine and metuzumab or cHAb18 combined with gemcitabine for 24 hour. β-actin was used as the internal control. Gray-scale value was analyzed the same as above. The numbers indicate relative protein expression normalized to β-actin. The bars represent each sample performed in triplicate, and the error bars represent mean ± SD. ***p < 0.001.

Figure 5. Metuzumab induces dCK expression in vitro and in vivo. (A) Western blot analysis on the level of dCK expression in A549, NCI-H460 or NCI-H520 cells treated with human IgG1, metuzumab or cHAb18 for 24 hour. β-actin was used as the internal control. Gray-scale value was analyzed the same as above. The numbers indicate relative protein expression normalized to β-actin. (B) Immunohistochemical staining for dCK expression in nude mice bearing A549 cell xenograft received saline or metuzumab treatment. Scale bar represents 50 μm. Histogram represents the integrated optical density (IOD) of dCK expression. The bars represent each sample performed in triplicate, and the error bars indicate mean ± SD. **p < 0.01. ***p < 0.001.
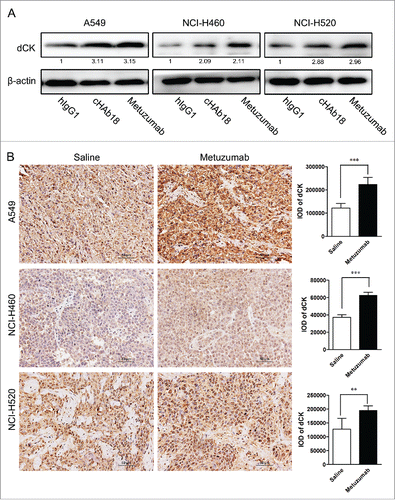
Figure 5. Metuzumab induces dCK expression in vitro and in vivo. (A) Western blot analysis on the level of dCK expression in A549, NCI-H460 or NCI-H520 cells treated with human IgG1, metuzumab or cHAb18 for 24 hour. β-actin was used as the internal control. Gray-scale value was analyzed the same as above. The numbers indicate relative protein expression normalized to β-actin. (B) Immunohistochemical staining for dCK expression in nude mice bearing A549 cell xenograft received saline or metuzumab treatment. Scale bar represents 50 μm. Histogram represents the integrated optical density (IOD) of dCK expression. The bars represent each sample performed in triplicate, and the error bars indicate mean ± SD. **p < 0.01. ***p < 0.001.
Supplemental material

Supplemental_Data.zip

Download Zip (10.7 MB)