1,587
Views
19
CrossRef citations to date
0
Altmetric
Research Paper

Curcumin induces apoptosis in human leukemic cell lines through an IFIT2-dependent pathway

, , , , &
Pages 43-50 | Received 02 Sep 2016, Accepted 18 Dec 2016, Published online: 26 Jan 2017

Figures & data

Figure 1. Sensitivity of leukemia cell lines to curcumin (A) Leukemia cells(NB4,NB4-R1, HL60, K562 and U937) were treated with curcumin, IC50 were determined by MTT assay. (B-C) K562 and U937 were exposed to curcumin (0, 2.5, 5 and 10 μM), cell viability were measured by MTT on 24 h and 48 h; Each value were represents the mean ± SD.

Figure 1. Sensitivity of leukemia cell lines to curcumin (A) Leukemia cells(NB4,NB4-R1, HL60, K562 and U937) were treated with curcumin, IC50 were determined by MTT assay. (B-C) K562 and U937 were exposed to curcumin (0, 2.5, 5 and 10 μM), cell viability were measured by MTT on 24 h and 48 h; Each value were represents the mean ± SD.

Figure 2. Effects of curcumin on cell cycle arrest in leukemia cell lines. (A) curcumin induced the cell cycle arrest in K562 and U937 cells. (B) The percentage of cells in G1, S and G2/M of cell cycle when treated with curcumin. *p < 0.05,***p < 0.001.
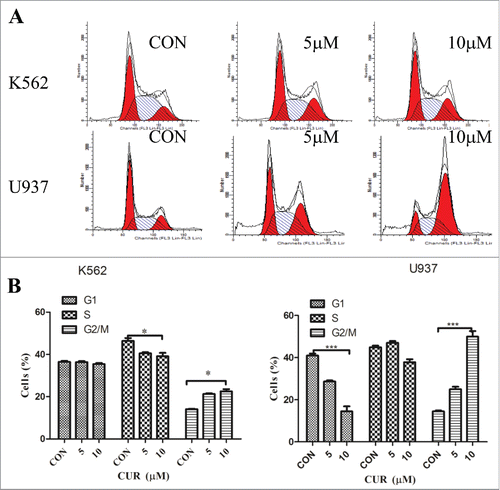
Figure 2. Effects of curcumin on cell cycle arrest in leukemia cell lines. (A) curcumin induced the cell cycle arrest in K562 and U937 cells. (B) The percentage of cells in G1, S and G2/M of cell cycle when treated with curcumin. *p < 0.05,***p < 0.001.

Figure 3. Effect of curcumin on inducing apoptosis in leukemia cell lines. (A)The percentage of early apoptosis and late apoptosis were detected by Annexin-V/PtdIns double-staining assay. The percentage of apoptotic cell in different concentration of curcumin. Each value were represents the mean ± SD ns means not significant, *p < 0.05,***p < 0.001. (B) K562 and U937 cells treated with curcumin, apoptosic proteins (caspase3 and PAPR) and the apoptosis inhibitor protein Bcl2 were dectected by western blot.

Figure 3. Effect of curcumin on inducing apoptosis in leukemia cell lines. (A)The percentage of early apoptosis and late apoptosis were detected by Annexin-V/PtdIns double-staining assay. The percentage of apoptotic cell in different concentration of curcumin. Each value were represents the mean ± SD ns means not significant, *p < 0.05,***p < 0.001. (B) K562 and U937 cells treated with curcumin, apoptosic proteins (caspase3 and PAPR) and the apoptosis inhibitor protein Bcl−2 were dectected by western blot.
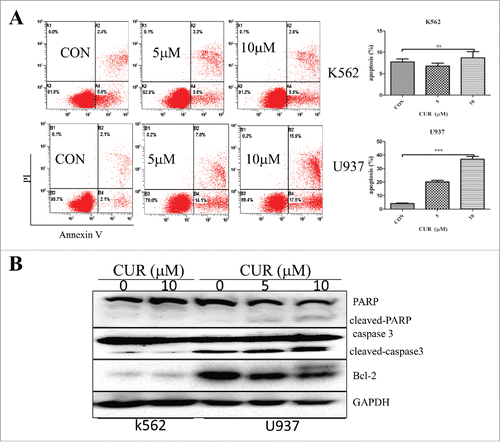
Figure 4. (A) Curcumin induces the expression of interferon regulatory genes in U937 but not in K562 cells Change of partial genes expression in U937 treated with curcumin (10μmol/L) for 24 h analyzed by gene chip; (B) Validation of genes expression in U937 and K562 when treated with curcumin for 24 h by RT-PCR. Each value were represents the mean ± SD; (D) Validation of genes (SKP2, IFIT22, IFIT3) expression in U937 and K562 when treated with curcumin for 24 h by western blot array.
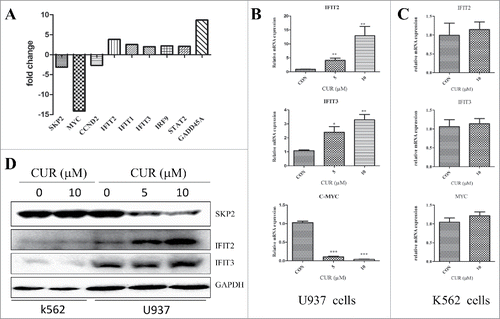
Figure 4. (A) Curcumin induces the expression of interferon regulatory genes in U937 but not in K562 cells Change of partial genes expression in U937 treated with curcumin (10μmol/L) for 24 h analyzed by gene chip; (B) Validation of genes expression in U937 and K562 when treated with curcumin for 24 h by RT-PCR. Each value were represents the mean ± SD; (D) Validation of genes (SKP2, IFIT22, IFIT3) expression in U937 and K562 when treated with curcumin for 24 h by western blot array.

Figure 5. Knockdown of IFIT2 by shRNA decreases curcumin-induced apoptosis (A) IFIT2 specific shRNA or nonspecific (ns) shRNA lentivirals infected U937 cells for 72 hours, and cells stimulated with curcumin (10μM) for 24 hours. The knockdown efficiency of endogenous IFIT2 were analyzed by RT-qPCR. (B and C) Cells expressing IFIT2 specific shRNA or nonspecific (ns) shRNA were evaluated for their apoptotic response to curcumin by Annexin-V/PtdIns double-staining assay and flow cytometry. **p < 0.01,***p < 0.001.
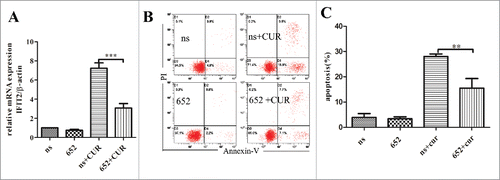
Figure 5. Knockdown of IFIT2 by shRNA decreases curcumin-induced apoptosis (A) IFIT2 specific shRNA or nonspecific (ns) shRNA lentivirals infected U937 cells for 72 hours, and cells stimulated with curcumin (10μM) for 24 hours. The knockdown efficiency of endogenous IFIT2 were analyzed by RT-qPCR. (B and C) Cells expressing IFIT2 specific shRNA or nonspecific (ns) shRNA were evaluated for their apoptotic response to curcumin by Annexin-V/PtdIns double-staining assay and flow cytometry. **p < 0.01,***p < 0.001.

Figure 6. Exogenous overexpression of IFIT2 enhances sensitivity of K562 cells to curcumin (A) FIT2 gene-containing lentiviral infected K562 cells and detected the expression of IFIT2 by RT-PCR and western blot; (B) the expression of c-myc and skp2 were analyzed by RT-PCR after overexpression of IFIT2; (C) K562, K562-Vector and K562-IFIT2 were treated with or without 10μmol/L for 24 h, Annexin-V/PtdIns double-staining assay was used to detect percentage of apoptotic cells. *P < 0.05; ***P < 0.001.
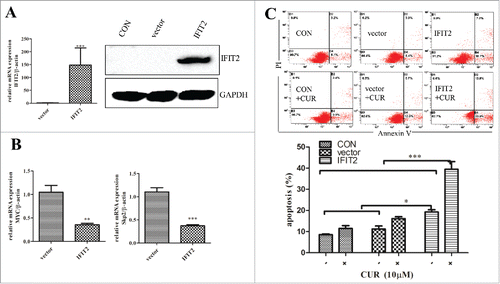
Figure 6. Exogenous overexpression of IFIT2 enhances sensitivity of K562 cells to curcumin (A) FIT2 gene-containing lentiviral infected K562 cells and detected the expression of IFIT2 by RT-PCR and western blot; (B) the expression of c-myc and skp2 were analyzed by RT-PCR after overexpression of IFIT2; (C) K562, K562-Vector and K562-IFIT2 were treated with or without 10μmol/L for 24 h, Annexin-V/PtdIns double-staining assay was used to detect percentage of apoptotic cells. *P < 0.05; ***P < 0.001.

Figure 7. Effect of curcumin combined with IFN on inducing apoptosis of K562. (A) Expression of IFIT2 and IFIT3 in K562 cells was measured by western blot after treating with curcumin, IFNγ, or both IFNγ and curcumin; (B) The apoptosis were analyzed in K562 cells following treatment of curcumin, FNγ, or FNγ combined with curcmin by FMC assay; (C) The percentage of apoptotic cells in K562 treated with curcumin, IFNγ, or both curcumin and IFNγ. Each value were represents the mean ± SD(n = 3). ns means not significant; *P < 0.05; **P < 0.01.
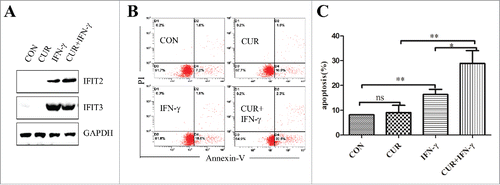
Figure 7. Effect of curcumin combined with IFN on inducing apoptosis of K562. (A) Expression of IFIT2 and IFIT3 in K562 cells was measured by western blot after treating with curcumin, IFNγ, or both IFNγ and curcumin; (B) The apoptosis were analyzed in K562 cells following treatment of curcumin, FNγ, or FNγ combined with curcmin by FMC assay; (C) The percentage of apoptotic cells in K562 treated with curcumin, IFNγ, or both curcumin and IFNγ. Each value were represents the mean ± SD(n = 3). ns means not significant; *P < 0.05; **P < 0.01.

Reprints and Corporate Permissions

Please note: Selecting permissions does not provide access to the full text of the article, please see our help page How do I view content?

To request a reprint or corporate permissions for this article, please click on the relevant link below:

Academic Permissions

Please note: Selecting permissions does not provide access to the full text of the article, please see our help page How do I view content?

Obtain permissions instantly via Rightslink by clicking on the button below:

If you are unable to obtain permissions via Rightslink, please complete and submit this Permissions form. For more information, please visit our Permissions help page.