848
Views
6
CrossRef citations to date
0
Altmetric
Research Paper

The expression of asparaginyl endopeptidase promotes growth potential in epithelial ovarian cancer

, &
Pages 222-228 | Received 26 Sep 2016, Accepted 08 Feb 2017, Published online: 15 Mar 2017

Figures & data

Figure 1. The expression of AEP in EOC patient samples was higher than those in benign ovarian tumor patient samples. (A) AEP was stained in the benign ovarian tumor, EOC and EOC metastasis tissues by immunohistochemistry. (B) Representative IHC staining of AEP protein levels in EOC tissues (n = 20), EOC metastasis (n = 3), fallopian tube metastasis (n = 6), peritoneum metastasis (n = 4) and benign ovarian tumor tissues (n = 20). IRS scoring system was used to evaluate the expression of AEP. (C) The expression of AEP was detected in serum and ascites of EOC patients by Elisa.
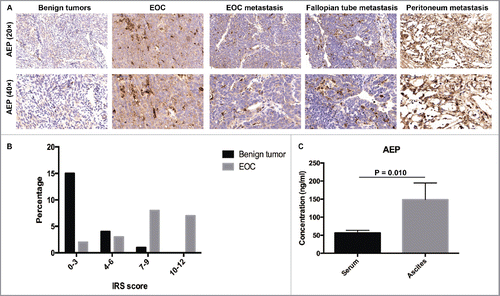
Figure 1. The expression of AEP in EOC patient samples was higher than those in benign ovarian tumor patient samples. (A) AEP was stained in the benign ovarian tumor, EOC and EOC metastasis tissues by immunohistochemistry. (B) Representative IHC staining of AEP protein levels in EOC tissues (n = 20), EOC metastasis (n = 3), fallopian tube metastasis (n = 6), peritoneum metastasis (n = 4) and benign ovarian tumor tissues (n = 20). IRS scoring system was used to evaluate the expression of AEP. (C) The expression of AEP was detected in serum and ascites of EOC patients by Elisa.

Figure 2. The establishment of AEP-SKOV3ip cells by stable transfection. (A) The transfection efficiency of AEP-SKOV3ip cells was measured by Real-time PCR. (B) The transfection efficiency of AEP-SKOV3ip cells was measured by Western Blot. (C) Quantitative data for the western blot was measured by ImageJ software. (D) The transfection efficiency in AEP-SKOV3ip-GFP cells and NC-SKOV3ip-GFP cells were detected under a fluorescence microscope. Scale bar, 100μm.
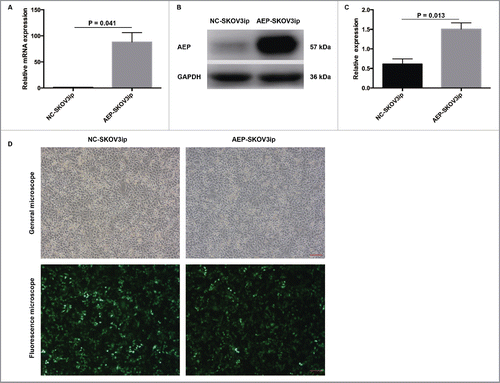
Figure 2. The establishment of AEP-SKOV3ip cells by stable transfection. (A) The transfection efficiency of AEP-SKOV3ip cells was measured by Real-time PCR. (B) The transfection efficiency of AEP-SKOV3ip cells was measured by Western Blot. (C) Quantitative data for the western blot was measured by ImageJ software. (D) The transfection efficiency in AEP-SKOV3ip-GFP cells and NC-SKOV3ip-GFP cells were detected under a fluorescence microscope. Scale bar, 100μm.

Figure 3. Overexpressed AEP in human SKOV3ip cells and the proliferative ability changed. (A) The cell numbers of AEP-SKOV3ip cells was increased faster as compared with NC-SKOV3ip cells by MTT assay. (B) The cell numbers of AEP-SKOV3ip cells was more than NC-SKOV3ip cells by migration assay. (C) Migration capacity of AEP-SKOV3ip cells was performed using transwell assay. (D) The supernatant of AEP-SKOV3ip cells could increase the tube forming capacity of HUVECs by tube formation assay. (E) Grapical illustration of the AEP-SKOV3ip cells on the branching points of the capillary-like structures in HUVECs. Scale bar, 100µm.
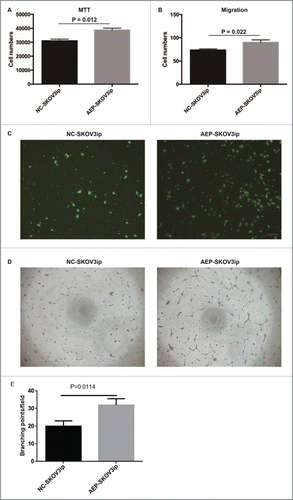
Figure 3. Overexpressed AEP in human SKOV3ip cells and the proliferative ability changed. (A) The cell numbers of AEP-SKOV3ip cells was increased faster as compared with NC-SKOV3ip cells by MTT assay. (B) The cell numbers of AEP-SKOV3ip cells was more than NC-SKOV3ip cells by migration assay. (C) Migration capacity of AEP-SKOV3ip cells was performed using transwell assay. (D) The supernatant of AEP-SKOV3ip cells could increase the tube forming capacity of HUVECs by tube formation assay. (E) Grapical illustration of the AEP-SKOV3ip cells on the branching points of the capillary-like structures in HUVECs. Scale bar, 100µm.

Figure 4. AEP-SKOV3ip cells promote growth potential in mice subcutaneous model. (A) The tumor weights (g) of AEP-SKOV3ip group were significant heavier than that of NC-SKOV3ip group. (B) The tumor volumes of AEP-SKOV3ip group were larger than that of NC-SKOV3ip group. (C) The MVD of AEP-SKOV3ip group was significant higher than that of NC-SKOV3ip group. (D) The expression of MVD in AEP-SKOV3ip and NC-SKOV3ip group was evaluated by immunohistochemistry at ×200 magnifications. Scale bar, 100µm.
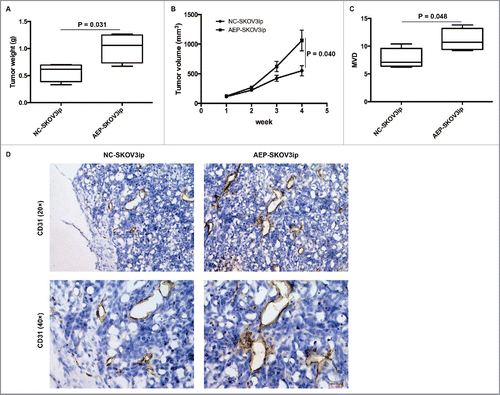
Figure 4. AEP-SKOV3ip cells promote growth potential in mice subcutaneous model. (A) The tumor weights (g) of AEP-SKOV3ip group were significant heavier than that of NC-SKOV3ip group. (B) The tumor volumes of AEP-SKOV3ip group were larger than that of NC-SKOV3ip group. (C) The MVD of AEP-SKOV3ip group was significant higher than that of NC-SKOV3ip group. (D) The expression of MVD in AEP-SKOV3ip and NC-SKOV3ip group was evaluated by immunohistochemistry at ×200 magnifications. Scale bar, 100µm.
Supplemental material

Supplemental_Figures.zip

Download Zip (3.3 MB)

Reprints and Corporate Permissions

Please note: Selecting permissions does not provide access to the full text of the article, please see our help page How do I view content?

To request a reprint or corporate permissions for this article, please click on the relevant link below:

Academic Permissions

Please note: Selecting permissions does not provide access to the full text of the article, please see our help page How do I view content?

Obtain permissions instantly via Rightslink by clicking on the button below:

If you are unable to obtain permissions via Rightslink, please complete and submit this Permissions form. For more information, please visit our Permissions help page.