1,541
Views
15
CrossRef citations to date
0
Altmetric
Research Paper

Vandetanib and cabozantinib potentiate mitochondria-targeted agents to suppress medullary thyroid carcinoma cells

, , &
Pages 473-483 | Received 17 Jan 2017, Accepted 23 Apr 2017, Published online: 14 Jun 2017

Figures & data

Figure 1. TT and MZ-CRC-1 cells can develop resistance to vandetanib and cabozantinib. Progenies of TT and MZ-CRC-1 resistant to vandetanib (TT/rV and MZ/rV, respectively) or to cabozantinib (TT/rC and MZ/rC, respectively) were generated by prolonged cell culture in the presence of those drugs, as described in the text. (A) Parental and drug-resistant TT and MZ-CRC-1 cells in 12 well plates were treated with increasing doses of vandetanib (Vand) and cabozantinib (Cabo) for 48 hours. Cells were then allowed to recover in drug-free fresh culture medium for 48 hours before measuring viability by MTT assay. Data (mean ± SD, n = 4) are expressed as the percentage of untreated controls. (B) Parental and drug-resistant cells were incubated in the culture media containing 1 µM vandetanib or cabozantinib. Cell viability was determined by MTT assay at days 5 and 10. Data (mean ± SD, n = 4) are expressed as fold changes relative to the initial cell cultures. (C) Cells treated as in (B) were subject to cell cycle analysis using propidium iodide at drug treatment day 4. Data (mean ± SD, n = 3) are expressed as the percentage of untreated controls. Cell cycle histograms are shown in Fig. S3. (D) Western blot analysis of total lysates of cells treated with increasing doses of vandetanib or cabozantinib for 3 d. GAPDH is a loading control.
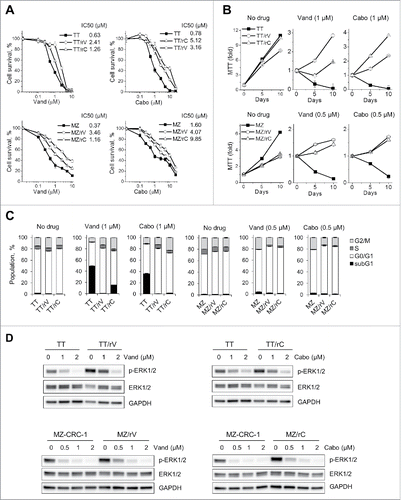
Figure 1. TT and MZ-CRC-1 cells can develop resistance to vandetanib and cabozantinib. Progenies of TT and MZ-CRC-1 resistant to vandetanib (TT/rV and MZ/rV, respectively) or to cabozantinib (TT/rC and MZ/rC, respectively) were generated by prolonged cell culture in the presence of those drugs, as described in the text. (A) Parental and drug-resistant TT and MZ-CRC-1 cells in 12 well plates were treated with increasing doses of vandetanib (Vand) and cabozantinib (Cabo) for 48 hours. Cells were then allowed to recover in drug-free fresh culture medium for 48 hours before measuring viability by MTT assay. Data (mean ± SD, n = 4) are expressed as the percentage of untreated controls. (B) Parental and drug-resistant cells were incubated in the culture media containing 1 µM vandetanib or cabozantinib. Cell viability was determined by MTT assay at days 5 and 10. Data (mean ± SD, n = 4) are expressed as fold changes relative to the initial cell cultures. (C) Cells treated as in (B) were subject to cell cycle analysis using propidium iodide at drug treatment day 4. Data (mean ± SD, n = 3) are expressed as the percentage of untreated controls. Cell cycle histograms are shown in Fig. S3. (D) Western blot analysis of total lysates of cells treated with increasing doses of vandetanib or cabozantinib for 3 d. GAPDH is a loading control.

Figure 2. Vandetanib and cabozantinib alter mitochondrial membrane potential in TT and MZ-CRC-1 cells. (A) Parental TT and MZ-CRC-1 cells, treated with 1 μM of vandetanib (Vand) and cabozantinib (Cabo) for 1 or 2 days, were stained with TMRE. Cellular TMRE retention was analyzed by flow cytometry measuring red fluorescence (PE channel, 575 nm). (B) Flow cytometry to determine basal level TMRE staining in parental and drug-resistant TT cells incubated without drugs for 5 d. (C) Mean fluorescence intensities (MFI) of TMRE-stained cells in (B) quantified by FCS Express software. (D) Cells in (B) were then treated with 1 or 2 μM vandetanib or cabozantinib for 48 hours before TMRE staining. E, MFI in (D) were quantified by FCS Express software to compare the effect of drugs in parental and resistant cells. Data (mean ± SEM, n = number of gated events) are expressed as arbitrary units, *p < 0.0001, t-test.
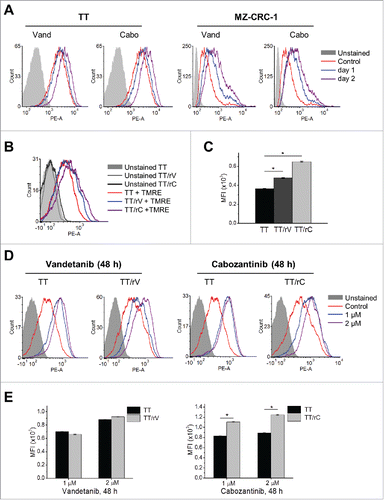
Figure 2. Vandetanib and cabozantinib alter mitochondrial membrane potential in TT and MZ-CRC-1 cells. (A) Parental TT and MZ-CRC-1 cells, treated with 1 μM of vandetanib (Vand) and cabozantinib (Cabo) for 1 or 2 days, were stained with TMRE. Cellular TMRE retention was analyzed by flow cytometry measuring red fluorescence (PE channel, 575 nm). (B) Flow cytometry to determine basal level TMRE staining in parental and drug-resistant TT cells incubated without drugs for 5 d. (C) Mean fluorescence intensities (MFI) of TMRE-stained cells in (B) quantified by FCS Express software. (D) Cells in (B) were then treated with 1 or 2 μM vandetanib or cabozantinib for 48 hours before TMRE staining. E, MFI in (D) were quantified by FCS Express software to compare the effect of drugs in parental and resistant cells. Data (mean ± SEM, n = number of gated events) are expressed as arbitrary units, *p < 0.0001, t-test.

Figure 3. Drug-resistant TT and MZ-CRC-1 cells tolerate vandetanib- and cabozantinib-caused bioenergetics alteration better than their parental cells. Parental and vandetanib-resistant TT (TT/rV) cells were treated with 1 μM vandetanib (Vand) or cabozantinib (Cabo) for 1 and 2 d before the extracellular flux assay. (A) OCR in parental TT and TT/rV cells were determined as described in Material and Methods. (B) Basal and maximal OCR (percent changes to untreated) calculated from (A). (C) ECAR is expressed as percent changes to untreated. Data (mean ± SD, n = 10) are normalized to cellular protein levels, *p < 0.0001, t-test.
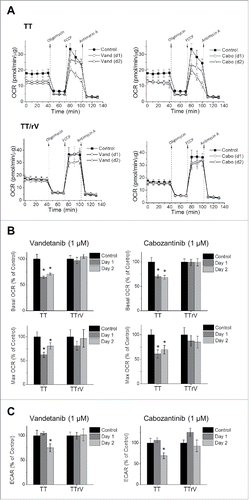
Figure 3. Drug-resistant TT and MZ-CRC-1 cells tolerate vandetanib- and cabozantinib-caused bioenergetics alteration better than their parental cells. Parental and vandetanib-resistant TT (TT/rV) cells were treated with 1 μM vandetanib (Vand) or cabozantinib (Cabo) for 1 and 2 d before the extracellular flux assay. (A) OCR in parental TT and TT/rV cells were determined as described in Material and Methods. (B) Basal and maximal OCR (percent changes to untreated) calculated from (A). (C) ECAR is expressed as percent changes to untreated. Data (mean ± SD, n = 10) are normalized to cellular protein levels, *p < 0.0001, t-test.

Figure 4. Vandetanib and cabozantinib potentiate cytotoxicity of mitochondria-targeted drugs in TT and MZ-CRC-1 cells. (A) TT cells, pretreated with 1 or 2 μM vandetanib or cabozantinib for 2 days, were treated with 2 μM Mito-CP for 1 hour. Mitochondrial lysates of these cells were analyzed by Western blotting to detect the formation of TPP adducts using an antibody specific to the TPP moiety of Mito-CP. Cytochrome c oxidase subunit IV (COX IV) is a loading control. (B and C), Parental TT (B) and MZ-CRC-1 (C) cells, pretreated with 1 μM vandetanib or cabozantinib for 2 days, were treated with 1 and 5 μM Mito-CP for 24 hours. Total cell lysates were analyzed by Western blotting for indicated proteins. (D and E), TT (D) and MZ-CRC-1 (E) cells in 24-well plates, pretreated with 1 μM vandetanib or cabozantinib for 2 days, were treated with increasing doses of Mito-CP and Mito-Q for 24 hours. Cells were then allowed to recover in drug-free medium for 48 hours before MTT assay. Data (mean ± SD, n = 4) are expressed as the percentage of the Mito-CP-untreated controls, *p < 0.0001, t-test. F, Chou-Talalay plot of the data in (D) and (E) to determine CI as a function of effect level (Fa).
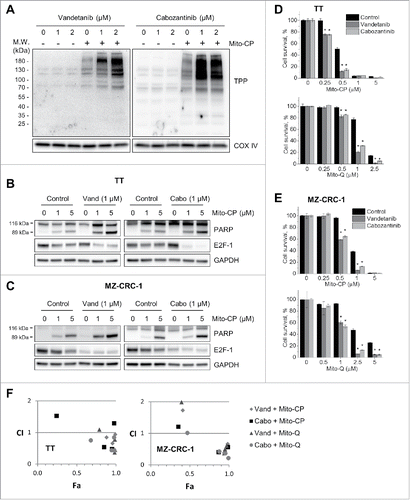
Figure 4. Vandetanib and cabozantinib potentiate cytotoxicity of mitochondria-targeted drugs in TT and MZ-CRC-1 cells. (A) TT cells, pretreated with 1 or 2 μM vandetanib or cabozantinib for 2 days, were treated with 2 μM Mito-CP for 1 hour. Mitochondrial lysates of these cells were analyzed by Western blotting to detect the formation of TPP adducts using an antibody specific to the TPP moiety of Mito-CP. Cytochrome c oxidase subunit IV (COX IV) is a loading control. (B and C), Parental TT (B) and MZ-CRC-1 (C) cells, pretreated with 1 μM vandetanib or cabozantinib for 2 days, were treated with 1 and 5 μM Mito-CP for 24 hours. Total cell lysates were analyzed by Western blotting for indicated proteins. (D and E), TT (D) and MZ-CRC-1 (E) cells in 24-well plates, pretreated with 1 μM vandetanib or cabozantinib for 2 days, were treated with increasing doses of Mito-CP and Mito-Q for 24 hours. Cells were then allowed to recover in drug-free medium for 48 hours before MTT assay. Data (mean ± SD, n = 4) are expressed as the percentage of the Mito-CP-untreated controls, *p < 0.0001, t-test. F, Chou-Talalay plot of the data in (D) and (E) to determine CI as a function of effect level (Fa).

Figure 5. Vandetanib and cabozantinib potentiate cytotoxicity of Mito-CP in drug-resistant TT cells. (A) Basal level Mito-CP sensitivity of drug-resistant TT cells maintained under drug-free culture conditions for 5 d. Cells in 24-well plates were then treated with increasing doses of Mito-CP for 48 hours and recovered in drug-free medium for 48 hours before MTT assay. Data (mean ± SD, n = 4) are expressed as the percentage of untreated controls. (B) TT/rV and TT/rC cells in (A) were pretreated with 1 μM vandetanib or cabozantinib for 48 hours and then were treated with increasing doses of Mito-CP for 24 hours, followed by 48 hour recovery in drug-free medium before MTT assay. Data (mean ± SD, n = 4) are expressed as the percentage of each respective untreated control, *p < 0.0001, t-test. (C) Total lysates of TT/rV and TT/rC cells harvested at 24 hour recovery time-point in (B) were analyzed by Western Blotting.
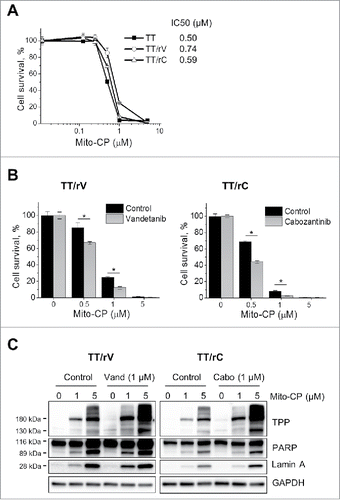
Figure 5. Vandetanib and cabozantinib potentiate cytotoxicity of Mito-CP in drug-resistant TT cells. (A) Basal level Mito-CP sensitivity of drug-resistant TT cells maintained under drug-free culture conditions for 5 d. Cells in 24-well plates were then treated with increasing doses of Mito-CP for 48 hours and recovered in drug-free medium for 48 hours before MTT assay. Data (mean ± SD, n = 4) are expressed as the percentage of untreated controls. (B) TT/rV and TT/rC cells in (A) were pretreated with 1 μM vandetanib or cabozantinib for 48 hours and then were treated with increasing doses of Mito-CP for 24 hours, followed by 48 hour recovery in drug-free medium before MTT assay. Data (mean ± SD, n = 4) are expressed as the percentage of each respective untreated control, *p < 0.0001, t-test. (C) Total lysates of TT/rV and TT/rC cells harvested at 24 hour recovery time-point in (B) were analyzed by Western Blotting.

Figure 6. Vandetanib potentiates Mito-CP in TT xenografts. Athymic mice bearing TT xenografts were treated with Mito-CP, vandetanib, and the combination of these compounds, respectively. Drugs dissolved in 200 μl vehicle (1:9 mixture of DMSO/Cremophore-EL) were orally administered by gavage every day for 4 d followed by 1 day break. Four cycles of this treatment were conducted. The control group received only the vehicle, the Mito-CP group received 80 mg drug/kg body weight/dose, the vandetanib group received 25 mg drug/kg body weight/dose, and the combination group received 2 doses of vandetanib followed by 2 doses of Mito-CP in a cycle. (A) Changes in tumor sizes were determined at the indicated time-points. (B) Images of tumors collected at the end of experiment. (C) Weights of tumors collected at the end of experiment. (D) Body weights of animals measured at the end of experiment. (E) Homogenates of tumor xenografts from each group were analyzed by Western blotting for Mito-CP adducts and cleaved PARP (detected by anti-PARP Asp214). Tubulin is a loading control. All data are mean ± SEM, (n = 4 per treatment group, n = 3 in vehicle group) *p < 0.05, **p < 0.01, ***p < 0.001 (black*, to control), One-Way ANOVA with Bonferroni correction for multiple comparisons.
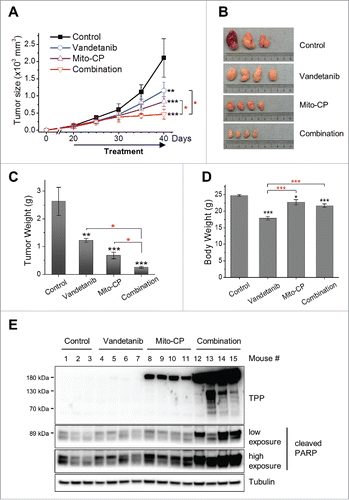
Figure 6. Vandetanib potentiates Mito-CP in TT xenografts. Athymic mice bearing TT xenografts were treated with Mito-CP, vandetanib, and the combination of these compounds, respectively. Drugs dissolved in 200 μl vehicle (1:9 mixture of DMSO/Cremophore-EL) were orally administered by gavage every day for 4 d followed by 1 day break. Four cycles of this treatment were conducted. The control group received only the vehicle, the Mito-CP group received 80 mg drug/kg body weight/dose, the vandetanib group received 25 mg drug/kg body weight/dose, and the combination group received 2 doses of vandetanib followed by 2 doses of Mito-CP in a cycle. (A) Changes in tumor sizes were determined at the indicated time-points. (B) Images of tumors collected at the end of experiment. (C) Weights of tumors collected at the end of experiment. (D) Body weights of animals measured at the end of experiment. (E) Homogenates of tumor xenografts from each group were analyzed by Western blotting for Mito-CP adducts and cleaved PARP (detected by anti-PARP Asp214). Tubulin is a loading control. All data are mean ± SEM, (n = 4 per treatment group, n = 3 in vehicle group) *p < 0.05, **p < 0.01, ***p < 0.001 (black*, to control), One-Way ANOVA with Bonferroni correction for multiple comparisons.
Supplemental material

Supplementary_Materials.zip

Download Zip (14.4 MB)

Reprints and Corporate Permissions

Please note: Selecting permissions does not provide access to the full text of the article, please see our help page How do I view content?

To request a reprint or corporate permissions for this article, please click on the relevant link below:

Academic Permissions

Please note: Selecting permissions does not provide access to the full text of the article, please see our help page How do I view content?

Obtain permissions instantly via Rightslink by clicking on the button below:

If you are unable to obtain permissions via Rightslink, please complete and submit this Permissions form. For more information, please visit our Permissions help page.