Figures & data
Figure 1. (A) Basic schematic of the MMR pathway in replication-coupled repair. During DNA replication, a misincorporation of nucleotide(s) results in the creation of mismatched base(s) in the daughter strand of the DNA. If DNA polymerase fails to recognize and correct the misincorporated base pair(s), the post -replicative MMR pathway is activated. A MutS heterodimer, incorporating MSH2 with MSH6 (MutSα) or MSH3 (MutSβ), recognizes the mismatch, and recruits MutLα (a MLH1 heterodimer PMS2) to nick the daughter strand at either the 3′- or -5′ end, depending on the location of the mismatch. Nicks in DNA are extended by Exo1, after which the DNA replication machinery fills in the correct base(s) and DNA ligase connects the new sections of the DNA. (B) Mapping of variants/mutants on MMR protein structures. Panels: A. Cartoon representation of MutSα. Purple: MSH2. Orange: MSH6. Magenta spheres: mutation sites. Cyan: dsDNA. Gray sphere and blue sticks: Mg2+ and ADP. (B) Cartoon representation of MutLα, with N-terminal domain on top and C-terminal domain below. Unstructured linker arms are represented as dashed lines and are not to scale. Green: MLH1. Cyan: PMS2. Magenta spheres: mutation sites. Cyan: dsDNA. Gray sphere and orange sticks in N-terminal domain: Mg2+ and ADP. Orange sticks on C-terminal domain: EXO1 fragment. C-G. Zoomed-in MSH2 mutations. H-K. Zoomed-in MLH1 mutations. L-O. Zoomed-in PMS2 mutations.
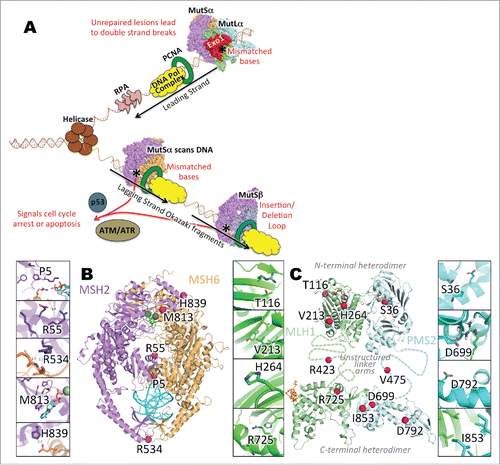
Table 1. Variant information, clinical classification and ExAC summary. Key: AA, amino acid; CMMR-D, constitutional MMR deficiency; CRC, colorectal cancer; HCPS, Hereditary Cancer Predisposing Syndrome; Hx, History; LS, Lynch Syndrome; MMR, Mismatch Repair; MSS, Microsatellite Stable; NF, Not Found; Pt, Patient. ExAC estimates were based on May 2016 data release (http://exac.broadinstitute.org/about).
Table 2. Summary of generic and gene-specific computational predictors. Key: AA, mutant amino acid; PP2, PolyPhen-2 score; MUTA, MutationAssessor score; BA, Biological Assembly SVM score; PROV, Provean score; N, neutral; M, moderate; D, damaging; n/a, not available. These predictive tools provide a variety of scores from which protein variants can be categorized as benign/neutral, pathogenic/disease causing, or intermediate /uncertain. For comparative purposes, raw prediction scores were translated into 3 classes (neutral, moderate, damaging) using the expanded criteria given in Table S2.
Figure 2. Analysis of MMR variant protein expression in HEK293 cell lines. (A-B) represents expression of MSH2 variants (P5Q, R55G, R534P, M813I, H839R) (dark gray bars) with corresponding MSH6 expression (light gray bars). (C-D) represents expression of MLH1 variants ((T116R, V213L, H264L, R423T, R725H) (dark gray bars) with corresponding PMS2 expression (light gray bars). (E-F) represents expression of PMS2 variants ((S36R, V475E, D699H, D792N, I853M) (dark gray bars) with corresponding PMS2 expression (light gray bars). For all experiments, E, empty vector transfection and WT, wild type transfection. (A, C, E) Quantification from 3 independent experiments ± SEM. Statistics were performed using a one-sample T-test, where * represents p < 0.05, ** represents p < 0.01 and *** represents p < 0.001. Protein was analyzed 48 hr post transfection. The data are analyzed relative to wt expression as % expression ± SEM. (B, D, F) Top image represents MSH2/MLH1/PMS2 with GAPDH and bottom image represents corresponding MSH6/PMS2/MLH1 with GAPDH
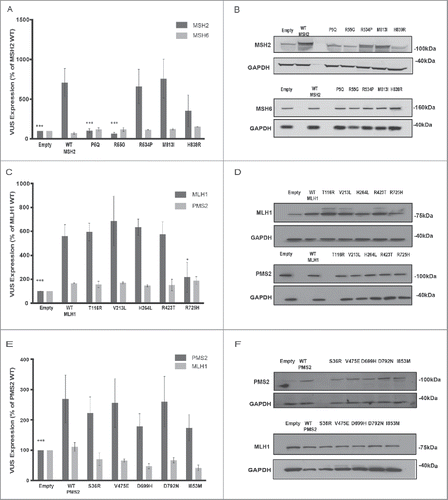
Table 3. Summary of experimental and structural analysis. AA, amino acid change; +, proficient; -, deficient; +(-), reduced or between empty and wt; wt, as wt; +(-)*; response likely different with different DNA damaging agent.
Figure 3. Expression of wt and MMR variants impacts cellular viability. LoVo (A, B), HCT116 (C, D), or Vaco481 (E, F) CRC cells were transfected with Empty vector (black bars) or wt (red bars) or VUS (dark gray bars) for MSH2 (A, B), MLH1 (C, D), or PMS2 (E, F). Cell viability (A, C, and E) was determined 72 hours post-transfection by CellTiter-Blue (CTB) assay. The data are represented as % viability relative to E and are from 3 independent experiments ± SEM. The statistical comparisons are with wt. Statistical analysis was performed using a generalized linear model, where * represents p < 0.05. B, D, and F) Post transfection (72 h) cells were assayed for caspase-3/7 activity using the Apo-ONE Homogeneous Caspase 3/7-activity kit according the manufacturer's protocols. Measurements were taken using a Perkin Elmer Envision Plate Reader and plotted as % of wt (red bars) from 3 independent experiments ± SEM. Statistics were performed using a generalized linear model, where * represents p < 0.05, ** represents p < 0.01 and *** represents p < 0.001.
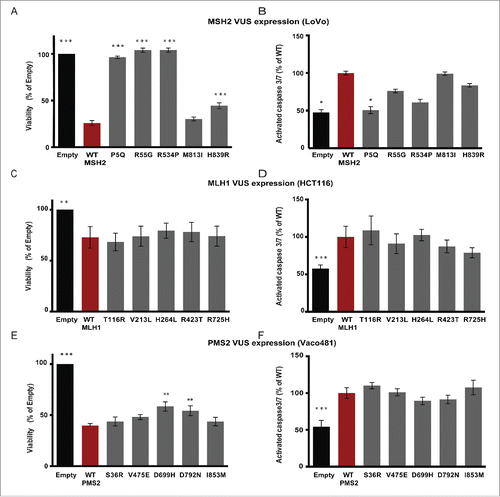
Figure 4. Impact of VUS on IC50 for DNA damaging drugs. LoVo (A-C), HCT116 (C-E), and Vaco481 (F-H) CRC cells were transfected with empty vector (E, black curves) or plasmid expressing wt (red curves) or VUS (gray curves) MSH2 (A-C), MLH1 (D-F), or PMS2 (G-I). 48 hours after transfection cells were treated with vehicle (V), methyl methanesulphonate (MMS), or cisplatin (CDDP) or 5-Flurouracil (5-FU) for 2 h at the concentrations indicated. Cell viability was measured by short-term CellTiter-Blue (CTB) assay (72 hours after drug addition). Data are represented as % viability and are from 3 independent experiments ± SEM. For extended p-values for log dose effect (slope) and log dose slope compared with wt see Table S3 (p-values hihglighted in red are significant).
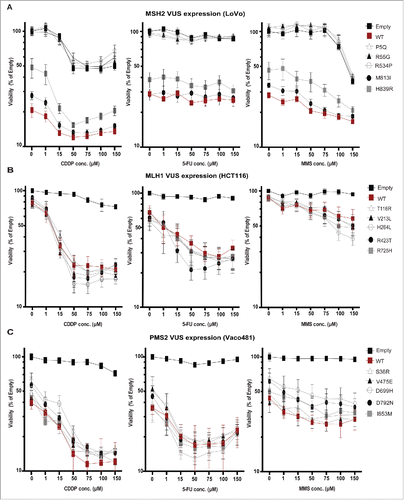
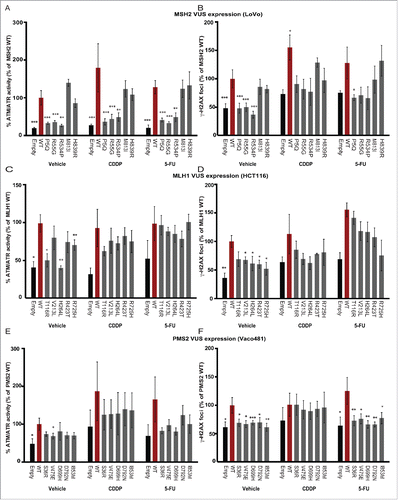
Figure 5. Impact of VUS on wt DNA damage signaling responses. ImageExpress automated quantitation of signal for ATM/ATR substrate phosphorylation (A, C, E.) or gH2AX (B, D, F) in Lovo (A, B), HCT116 (C, D) or Vaco481 (E, F) CRC cells. Imaging is performed 16 hours after drug treatment with vehicle (V), with 15 mM cisplatin (CDDP) or 5-flourouracil (5-FU) of cells transfected with empty vector (E, black bars) or plasmids expressing wt (red bars) or VUS for indicated proteins. Numbers reflect mean positive fluorescence (for ATM/ATR phosphorylation) or mean foci count (for gH2AX). Data are represented as % positive mean relative to wt and are from 3/4 independent experiments ± SEM. Statistical analysis was performed using a generalized linear model, where where * represents p < 0.05, ** represents p < 0.01 and *** represents p < 0.001.
