1,042
Views
13
CrossRef citations to date
0
Altmetric
Research Paper

Enhanced procoagulant activity of platelets after chemotherapy in non-small cell lung cancer

, , , &
Pages 627-634 | Received 25 Jan 2017, Accepted 17 Jun 2017, Published online: 21 Sep 2017

Figures & data

Table 1. Characters of patients with NSCLC before chemotherapy.

Table 2. Characters of platelets in healthy controls and NSCLC patients before chemotherapy.

Figure 1. Clotting time and TAT in patients with NSCLC within 7 d after chemotherapy. Blood of patients before and after chemotherapy was isolated, and clotting time of whole blood (a) and TAT level in serum (b) were measured. Data are present as mean ± SD, *P < 0.05 vs day 0, **P < 0.01 vs day 0.
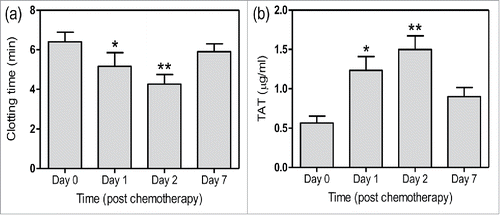
Figure 1. Clotting time and TAT in patients with NSCLC within 7 d after chemotherapy. Blood of patients before and after chemotherapy was isolated, and clotting time of whole blood (a) and TAT level in serum (b) were measured. Data are present as mean ± SD, *P < 0.05 vs day 0, **P < 0.01 vs day 0.

Figure 2. PS expression and PCA of platelets after chemotherapy. Platelets were isolated from patients before and after chemotherapy. (a) PS and TF expression on platelets were measured respectively with Alexa 488-lactadherin (green) and Alexa 647-anti CD142 (red) by flow cytometry. (b) Coagulation time was measured by coagulometer and thrombin and fibrin formation were evaluated with microplate reader. Data are present as mean ± SD, *P < 0.05 vs day 0, **P < 0.01 vs day 0.
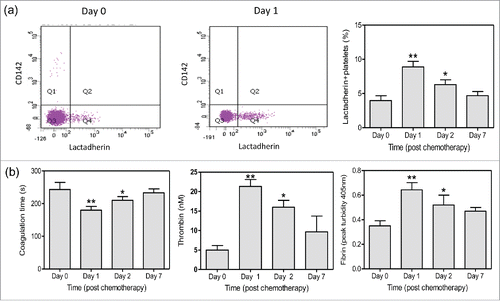
Figure 2. PS expression and PCA of platelets after chemotherapy. Platelets were isolated from patients before and after chemotherapy. (a) PS and TF expression on platelets were measured respectively with Alexa 488-lactadherin (green) and Alexa 647-anti CD142 (red) by flow cytometry. (b) Coagulation time was measured by coagulometer and thrombin and fibrin formation were evaluated with microplate reader. Data are present as mean ± SD, *P < 0.05 vs day 0, **P < 0.01 vs day 0.

Figure 3. The number of PMPs after chemotherapy. Platelets were isolated from patients before and after chemotherapy. (a,b) The number of total MPs and PMPs were analyzed by flow cytometry. PMPs were characterized by CD41a expression. Data are present as mean ± SD, **P < 0.01 vs day 0. (c) Confocal microscopy images showed quiescent platelets (left, arrow) and apoptotic platelets positive for lactadherin staining (right, arrow) with MPs (right, arrowheads) at day 1. Bars represent 2 µm.
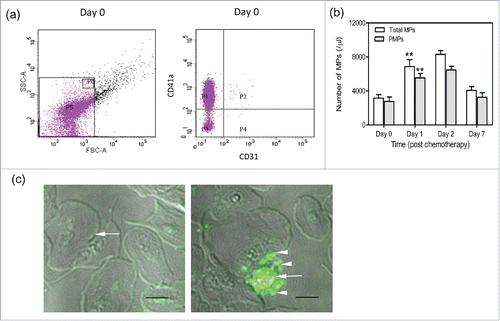
Figure 3. The number of PMPs after chemotherapy. Platelets were isolated from patients before and after chemotherapy. (a,b) The number of total MPs and PMPs were analyzed by flow cytometry. PMPs were characterized by CD41a expression. Data are present as mean ± SD, **P < 0.01 vs day 0. (c) Confocal microscopy images showed quiescent platelets (left, arrow) and apoptotic platelets positive for lactadherin staining (right, arrow) with MPs (right, arrowheads) at day 1. Bars represent 2 µm.

Figure 4. The effect of cisplatin on PCA of platelets. Platelets were isolated from healthy subjects and treated with cisplatin of different concentrations for 1 h in vitro. Coagulation time (a), intrinsic/extrinsic FXa and thrombin (b) as well as fibrin (c) formation were evaluated. Data are present as mean ± SD, *P < 0.05 vs untreated, **P < 0.01 vs untreated. (c) After 1µM cisplatin treatment of 1 h, quiescent platelets (left), activated platelets (middle) and apoptotic platelets with MPs (right) were shown by scanning microscopy images. Bars represent 1 µm.
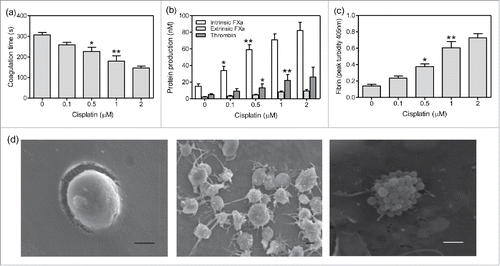
Figure 4. The effect of cisplatin on PCA of platelets. Platelets were isolated from healthy subjects and treated with cisplatin of different concentrations for 1 h in vitro. Coagulation time (a), intrinsic/extrinsic FXa and thrombin (b) as well as fibrin (c) formation were evaluated. Data are present as mean ± SD, *P < 0.05 vs untreated, **P < 0.01 vs untreated. (c) After 1µM cisplatin treatment of 1 h, quiescent platelets (left), activated platelets (middle) and apoptotic platelets with MPs (right) were shown by scanning microscopy images. Bars represent 1 µm.

Figure 5. The effect of anti-platelet agents and lactadherin on the PCA. After 1 µM cisplatin treatment of 1 h, platelets were treated with aspirin (100 nM) and lactadherin (2 nM). Coagulation time (a), intrinsic/extrinsic FXa and thrombin (b) as well as fibrin (c) formation of platelets were measured. Data are present as mean ± SD, *P < 0.05 vs control, **P < 0.01 vs control.

Figure 5. The effect of anti-platelet agents and lactadherin on the PCA. After 1 µM cisplatin treatment of 1 h, platelets were treated with aspirin (100 nM) and lactadherin (2 nM). Coagulation time (a), intrinsic/extrinsic FXa and thrombin (b) as well as fibrin (c) formation of platelets were measured. Data are present as mean ± SD, *P < 0.05 vs control, **P < 0.01 vs control.

Reprints and Corporate Permissions

Please note: Selecting permissions does not provide access to the full text of the article, please see our help page How do I view content?

To request a reprint or corporate permissions for this article, please click on the relevant link below:

Academic Permissions

Please note: Selecting permissions does not provide access to the full text of the article, please see our help page How do I view content?

Obtain permissions instantly via Rightslink by clicking on the button below:

If you are unable to obtain permissions via Rightslink, please complete and submit this Permissions form. For more information, please visit our Permissions help page.