Figures & data
Figure 1. Effects of the combined administration of LCL-PLP and LCL-5-FU on the growth of s.c. C26 colon carcinoma. Tumor volumes at day 12 after tumor cell inoculation (when mice were killed) after different treatments were presented in panels A, C, and E. AUTCs after various treatments were presented in panels B, D and F. The results were compared with PBS-treated groups (controls) and expressed as mean ± SD of tumor volumes of 5–6 mice.; ns - not significant (*P > 0.05); **P < 0.01; ***P < 0.001; Control - untreated group; LCL - group treated with empty liposomes; PLP - group treated with 20 mg/kg PLP as free form at days 8 and 11 after tumor cell inoculation; LCL-PLP - group treated with 20 mg/kg PLP as liposomal form at days 8 and 11 after tumor cell inoculation; 5-FU - group treated with 1.2 mg/kg 5-FU as free form at days 8 and 11 after tumor cell inoculation; LCL-5-FU - group treated with 1.2 mg/kg 5-FU as liposomal form at days 8 and 11 after tumor cell inoculation; PLP+5-FU - group treated with 20 mg/kg PLP and 1.2 mg/kg 5-FU, both drugs administered as free forms at days 8 and 11 after tumor cell inoculation; LCL-PLP+LCL-5-FU - group treated with 20 mg/kg LCL-PLP and 1.2 mg/kg LCL-5-FU at days 8 and 11 after tumor cell inoculation.
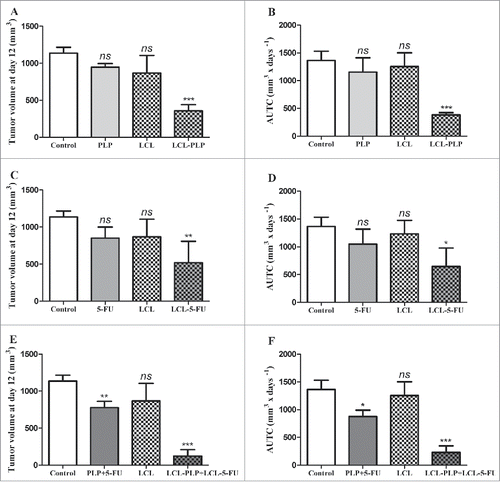
Table 1. The doubling time of C26 colon carcinoma growth after different treatments.
Figure 2. Effects of 2 different administration regimens of combined therapy (LCL-PLP+LCL-5-FU vs. LCL-PLP/LCL-5-FU) on s.c. C26 colon carcinoma growth. For each liposomal treatment scheme, as well as for the free drugs treatment schemes, tumor volumes at day 18 after tumor cell inoculation (when tumors from control group reached 2,000 mm3) were compared with the tumor volumes from control group (PBS-treated) measured at the same time point. The results were expressed as mean ± SD of tumor volumes of 5–6 mice. ns - not significant (P > 0.05); *P < 0.05; ***P < 0.001; Control - untreated group; LCL-PLP+LCL-5-FU - group treated with 20 mg/kg LCL-PLP and 1.2 mg/kg LCL-5-FU at days 8 and 11 after tumor cell inoculation; LCL - PLP/LCL-5-FU - group pretreated with 20 mg/kg LCL-PLP at days 8 and 11 after tumor cell inoculation with 24 h before administration of 1.2 mg/kg LCL-5-FU.
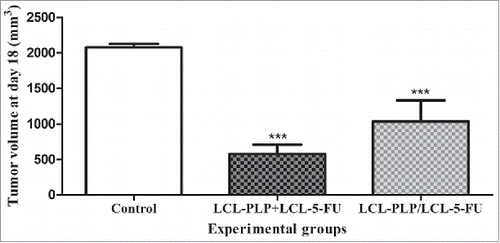
Figure 3. Effects of different treatments on the intratumor levels of p65 subunit of NF-κB and c-Jun subunit of AP-1. (A) Western blot analyses of NF-κB p65 and c-Jun levels in C26 tumor homogenates from each experimental group: Control - untreated group (lane 1); LCL-PLP - group treated with 20 mg/kg PLP as liposomal form at days 8 and 11 after tumor cell inoculation (lane 2); LCL-5-FU - group treated with 1.2 mg/kg 5-FU as liposomal form at days 8 and 11 after tumor cell inoculation (lane 3); LCL-PLP+LCL-5-FU - group treated with 20 mg/kg LCL-PLP and 1.2 mg/kg LCL-5-FU at days 8 and 11 after tumor cell inoculation (lane 4). β-actin was used as loading control. Quantification of western blot data for NF-κB p65 expression levels (B) and for c-Jun expression levels (C). The levels of proteins from each experimental group are compared with the control levels of the same proteins and are expressed as mean ± SD of 2 independent measurements; ns - not significant (P > 0.05); *P < 0.05; **P < 0.01; ***P < 0.001.
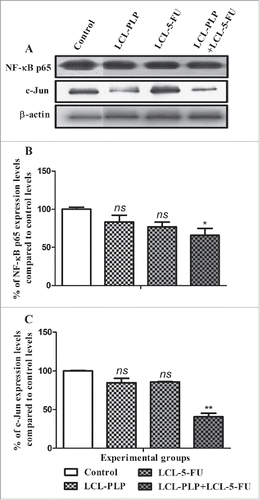
Figure 4. The effects of different treatments on angiogenic and inflammatory proteins production in s.c. C26 colon carcinoma tissue. The protein levels in tumors after different treatments are compared with the levels of the same proteins in control tumors. Data are expressed as average % of reduction of tumor protein levels ranging from 0% (white) to -100% (black) or stimulation (+) of production of proteins ranging from 0% (white) to +200% (red) compared with the levels of the same proteins in control tumors. LCL-PLP - group treated with 20 mg/kg PLP as liposomal form at days 8 and 11 after tumor cell inoculation; LCL-5-FU - group treated with 1.2 mg/kg 5-FU as liposomal form at days 8 and 11 after tumor cell inoculation; LCL-PLP+LCL-5-FU - group treated with 20 mg/kg LCL-PLP and 1.2 mg/kg LCL-5-FU at days 8 and 11 after tumor cell inoculation.
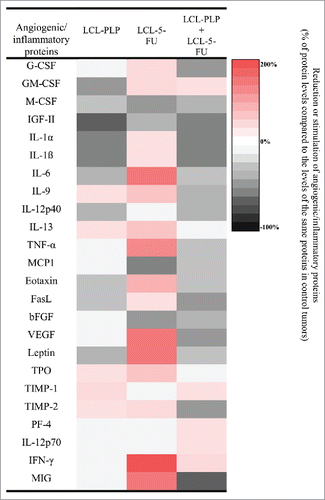
Table 2. The effects of LCL-PLP administered alone and in combination with LCL-5-FU on angiogenic and inflammatory protein production in s.c. C26 colon carcinoma.
Table 3. Immunohistochemical examination of macrophages infiltration in s.c. C26 colon carcinoma tumor tissues after different treatments.
Figure 5. Immunohistochemical analysis of the macrophage antigen F4/80 and iNOS in s.c. C26 colon carcinoma tissue. Positively stained cells appear in brown; size bars = 20 µm. Control - untreated group; LCL-PLP - group treated with 20 mg/kg PLP as liposomal form at days 8 and 11 after tumor cell inoculation; LCL-5-FU - group treated with 1.2 mg/kg 5-FU as liposomal form at days 8 and 11 after tumor cell inoculation; LCL-PLP+LCL-5-FU - group treated with 20 mg/kg LCL-PLP and 1.2 mg/kg LCL-5-FU at days 8 and 11 after tumor cell inoculation.
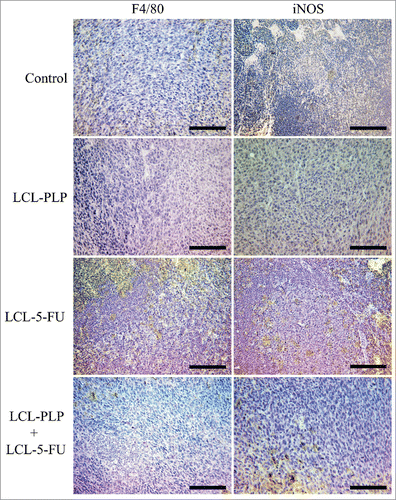
Figure 6. The effects of different treatments on the production ratio of IL-10/IL-12p70 in s.c. C26 colon carcinoma tissue. Levels of IL-10 and IL-12p70 cytokines are expressed as mean percentage ± SD compared with the expression levels of the same proteins in control tumors. Control - untreated group; LCL-PLP - group treated with 20 mg/kg PLP as liposomal form at days 8 and 11 after tumor cell inoculation; LCL-5-FU - group treated with 1.2 mg/kg 5-FU as liposomal form at days 8 and 11 after tumor cell inoculation; LCL-PLP+LCL-5-FU - group treated with 20 mg/kg LCL-PLP and 1.2 mg/kg LCL-5-FU at days 8 and 11 after tumor cell inoculation; ns - not significant (P > 0.05); **P < 0.01.
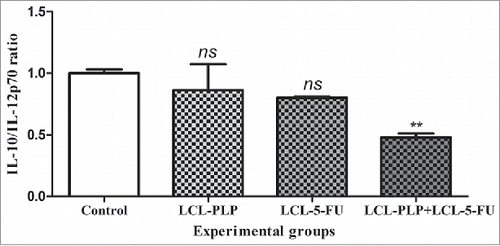
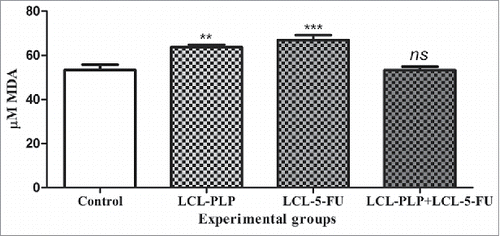
Figure 7. The effects of different treatments on MDA levels from C26 tumor homogenates. Data were expressed as mean ± SD of triplicate measurements. Control - untreated group; LCL-PLP - group treated with 20 mg/kg PLP as liposomal form at days 8 and 11 after tumor cell inoculation; LCL-5-FU - group treated with 1.2 mg/kg 5-FU as liposomal form at days 8 and 11 after tumor cell inoculation; LCL-PLP+LCL-5-FU - group treated with 20 mg/kg LCL-PLP and 1.2 mg/kg LCL-5-FU at days 8 and 11 after tumor cell inoculation; ns - not significant (P > 0.05); **P < 0.01; ***P < 0.001.