2,010
Views
7
CrossRef citations to date
0
Altmetric
Research Papers

Inactivation of miR-100 combined with arsenic treatment enhances the malignant transformation of BEAS-2B cells via stimulating epithelial -mesenchymal transition

, , , , , , , , , & ORCID Icon show all
Pages 965-973 | Received 03 Apr 2017, Accepted 17 Jun 2017, Published online: 20 Nov 2017

Figures & data

Figure 1. Inactivation of miR-100, combined with arsenic treatment, promotes proliferation of BEAS-2B cells. A. BEAS-2B cells with miR-100 inhibition were exposed to 0 or 0.25 μM As2O3 for 20, and 40 passages. MTT assay was performed to investigate the cell proliferation. The combination of miR-100 inhibition and chronic arsenic treatment promote the cell proliferation significantly. * p < 0.05, **p < 0.01. B. Cell cycle analysis by using flow cytometry system suggested that inhibition of miR-100 accelerated cell re-entering into the S phase, especially in as BEAS-2B(miR-100-inhibitor)-AS(40) cells.**p < 0.01. C. The colony-formation assay revealed that colony number and colony size were increased following inhibition of miR-100 in BEAS-2B cells, similar trend was observed in the AS-treated cells(AS (40) and AS (20)) when the expression of miR-100 was inhibited.*p < 0.05;**p < 0.01.
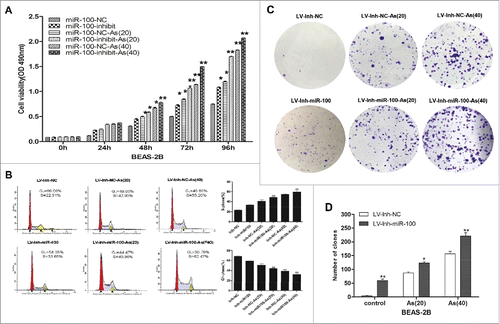
Figure 1. Inactivation of miR-100, combined with arsenic treatment, promotes proliferation of BEAS-2B cells. A. BEAS-2B cells with miR-100 inhibition were exposed to 0 or 0.25 μM As2O3 for 20, and 40 passages. MTT assay was performed to investigate the cell proliferation. The combination of miR-100 inhibition and chronic arsenic treatment promote the cell proliferation significantly. * p < 0.05, **p < 0.01. B. Cell cycle analysis by using flow cytometry system suggested that inhibition of miR-100 accelerated cell re-entering into the S phase, especially in as BEAS-2B(miR-100-inhibitor)-AS(40) cells.**p < 0.01. C. The colony-formation assay revealed that colony number and colony size were increased following inhibition of miR-100 in BEAS-2B cells, similar trend was observed in the AS-treated cells(AS (40) and AS (20)) when the expression of miR-100 was inhibited.*p < 0.05;**p < 0.01.

Figure 2. Inactivation of miR-100 combined with arsenic treatment promotes anchorage- independent growth of BEAS-2B cells. Left panel: The soft agar colony formation assay shows that inhibition of miR-100 promotes anchorage-independent growth of BEAS-2B cells. Right panel: Quantitative analysis of the agar colony formation. **p < 0.01.
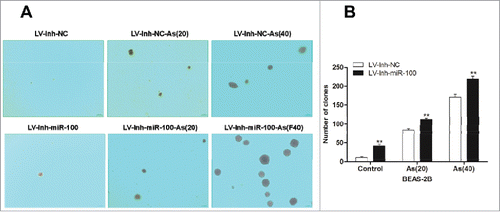
Figure 2. Inactivation of miR-100 combined with arsenic treatment promotes anchorage- independent growth of BEAS-2B cells. Left panel: The soft agar colony formation assay shows that inhibition of miR-100 promotes anchorage-independent growth of BEAS-2B cells. Right panel: Quantitative analysis of the agar colony formation. **p < 0.01.

Figure 3. Inactivation of miR-100 combined with arsenic treatment promotes migration of BEAS-2B cells. Left panel: Transwell assays were performed to evaluate the migratory capabilities of the cells untransfected, transfected with either a miR-100–3p inhibitor (Inh-miR-100) or a miR-100–3p inhibitor control (Inh-NC) with or without chronic arsenic treatment. Similar trend was observed in the AS-treated cells when the expression of miR-100 was inhibited, especially in as BEAS-2B (Inh-miR-100)-AS (20) or AS (40) cells. Right panel: Quantitative analysis of the migration rates. **p < 0.01.
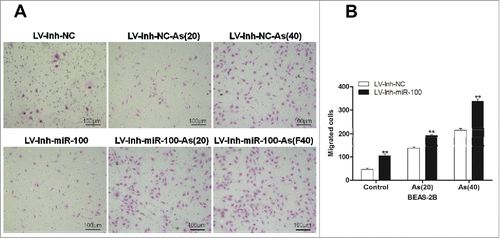
Figure 3. Inactivation of miR-100 combined with arsenic treatment promotes migration of BEAS-2B cells. Left panel: Transwell assays were performed to evaluate the migratory capabilities of the cells untransfected, transfected with either a miR-100–3p inhibitor (Inh-miR-100) or a miR-100–3p inhibitor control (Inh-NC) with or without chronic arsenic treatment. Similar trend was observed in the AS-treated cells when the expression of miR-100 was inhibited, especially in as BEAS-2B (Inh-miR-100)-AS (20) or AS (40) cells. Right panel: Quantitative analysis of the migration rates. **p < 0.01.

Figure 4. Inactivation of miR-100 combined with arsenic treatment promotes mammary tumor growth of BEAS-2B cells. A. the representative image showed mammary tumors from the miR-100 inactivation (Lv-Inh-miR100.) BEAS-2B cells with or without chronic arsenic treatment (0.25 μM) for 0, 20, 40 passages. B. Tumor size was monitored every 5 d after injection of BEAS-2B cells. C. Solid tumors were removed after the sacrifice at 90 d. The representative image showed mammary tumor size. D. Solid tumors from BEAS-2B cells were removed, and their weights were determined after sacrifice. The data were presented as the mean ± SEM (n = 5/group) *p < 0.05.
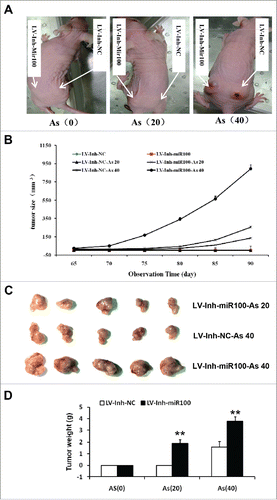
Figure 4. Inactivation of miR-100 combined with arsenic treatment promotes mammary tumor growth of BEAS-2B cells. A. the representative image showed mammary tumors from the miR-100 inactivation (Lv-Inh-miR100.) BEAS-2B cells with or without chronic arsenic treatment (0.25 μM) for 0, 20, 40 passages. B. Tumor size was monitored every 5 d after injection of BEAS-2B cells. C. Solid tumors were removed after the sacrifice at 90 d. The representative image showed mammary tumor size. D. Solid tumors from BEAS-2B cells were removed, and their weights were determined after sacrifice. The data were presented as the mean ± SEM (n = 5/group) *p < 0.05.

Figure 5. Morphological changes and Western Blotting evidences suggested that EMT is involved in the process. A. BEAS-2B cells with inhibited miR-100 were exposed to 0 or 0.25 μM of As2O3 for 0, 20, or 40 passages, and typical images with or without treatment are shown. Note the morphological shift of BEAS-2B cells from epithelial-like to mesenchymal-like when miR-100 inhibition. B, C. Chronic or acute exposure to As2O3 also induces the EMT-like phenotypical shift. Left panel: BEAS-2B cells with inhibited miR-100 were exposed to 0 or 0.25 μM of arsenic for 20, or 40 passages, or 5 μM of arsenic for 0, 6, 12, 24h. Western Blotting was performed to determine the protein expression levels of E-cadherin, Vimentin, MMP-3, MMP-9, β-catenin, and ZEB-1. Note that epithelial marker E-cadherin was inhibited by arsenic, whereas mesenchymal markers (Vimentin, MMP-3, and MMP-9) were upregulated. Right panel: Protein expression was quantified by band intensity and normalized to β-actin. *p < 0.05; **p < 0.01.
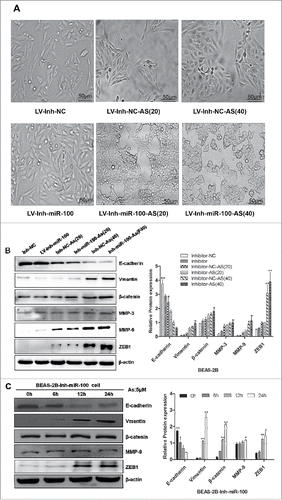
Figure 5. Morphological changes and Western Blotting evidences suggested that EMT is involved in the process. A. BEAS-2B cells with inhibited miR-100 were exposed to 0 or 0.25 μM of As2O3 for 0, 20, or 40 passages, and typical images with or without treatment are shown. Note the morphological shift of BEAS-2B cells from epithelial-like to mesenchymal-like when miR-100 inhibition. B, C. Chronic or acute exposure to As2O3 also induces the EMT-like phenotypical shift. Left panel: BEAS-2B cells with inhibited miR-100 were exposed to 0 or 0.25 μM of arsenic for 20, or 40 passages, or 5 μM of arsenic for 0, 6, 12, 24h. Western Blotting was performed to determine the protein expression levels of E-cadherin, Vimentin, MMP-3, MMP-9, β-catenin, and ZEB-1. Note that epithelial marker E-cadherin was inhibited by arsenic, whereas mesenchymal markers (Vimentin, MMP-3, and MMP-9) were upregulated. Right panel: Protein expression was quantified by band intensity and normalized to β-actin. *p < 0.05; **p < 0.01.