1,302
Views
4
CrossRef citations to date
0
Altmetric
Research Paper

The expression of ETAR in liver cirrhosis and liver cancer

, , , , , , & show all
Pages 723-729 | Received 10 May 2017, Accepted 23 Jul 2017, Published online: 13 Sep 2017

Figures & data

Table 1. The clinical data of liver cancer patient.

Table 2. The clinical data of compensated cirrhosis patients.

Table 3. The clinical data of hepatic hemangioma patients.

Figure 1. Representative western blot of relative protein expression from tissue samples. X: hepatic hemangioma; LC: liver cirrhosis; C: liver cancer; P: pra-carcinoma.

Figure 1. Representative western blot of relative protein expression from tissue samples. X: hepatic hemangioma; LC: liver cirrhosis; C: liver cancer; P: pra-carcinoma.

Figure 2. ETAR expression from tissue samples was visualized and localized by confocal microscopy. X: hepatic hemangioma; LC: liver cirrhosis; C: liver cancer; P: para-carcinoma.

Figure 2. ETAR expression from tissue samples was visualized and localized by confocal microscopy. X: hepatic hemangioma; LC: liver cirrhosis; C: liver cancer; P: para-carcinoma.

Figure 3. ETAR expressions in HSCs. α-SMA was a positive control for HSCs. White arrowheads indicate dual staining and/or close proximity of α-SMA and ETAR expression which could be visualized in merged images. X: hepatic hemangioma; LC: liver cirrhosis; C: liver cancer; P: para-carcinoma.

Figure 3. ETAR expressions in HSCs. α-SMA was a positive control for HSCs. White arrowheads indicate dual staining and/or close proximity of α-SMA and ETAR expression which could be visualized in merged images. X: hepatic hemangioma; LC: liver cirrhosis; C: liver cancer; P: para-carcinoma.
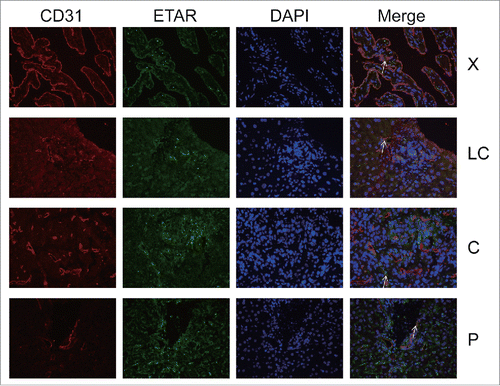
Figure 4. ETAR expressions in HSECs. CD31 was a positive control for HSECs. White arrowheads indicated dual staining and/or close proximity of α-SMA and ETAR expression which could be visualized in merged images. X: hepatic hemangioma; LC: liver cirrhosis; C: liver cancer; P: para-carcinoma.

Figure 4. ETAR expressions in HSECs. CD31 was a positive control for HSECs. White arrowheads indicated dual staining and/or close proximity of α-SMA and ETAR expression which could be visualized in merged images. X: hepatic hemangioma; LC: liver cirrhosis; C: liver cancer; P: para-carcinoma.

Figure 5. ETAR positive cells in liver tissue. X: hepatic hemangioma; LC: liver cirrhosis; C: liver cancer; P: para-carcinoma.
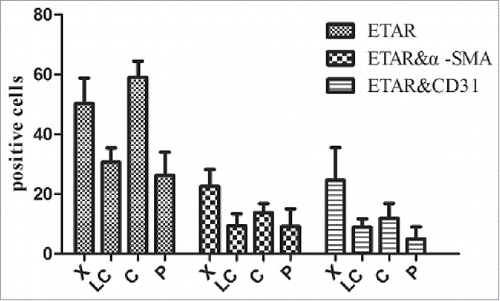
Figure 5. ETAR positive cells in liver tissue. X: hepatic hemangioma; LC: liver cirrhosis; C: liver cancer; P: para-carcinoma.

Figure 6. Correlation analysis of ETAR positive cells and clinical indexes. Liver function index included alanine transaminase (ALT), α fetoprotein (AFP), and platelet count (PLT).
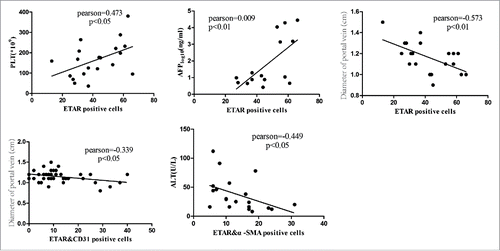
Figure 6. Correlation analysis of ETAR positive cells and clinical indexes. Liver function index included alanine transaminase (ALT), α fetoprotein (AFP), and platelet count (PLT).

Table 4. The analysis of relationship between fluorescent staining results and clinical data.

Reprints and Corporate Permissions

Please note: Selecting permissions does not provide access to the full text of the article, please see our help page How do I view content?

To request a reprint or corporate permissions for this article, please click on the relevant link below:

Academic Permissions

Please note: Selecting permissions does not provide access to the full text of the article, please see our help page How do I view content?

Obtain permissions instantly via Rightslink by clicking on the button below:

If you are unable to obtain permissions via Rightslink, please complete and submit this Permissions form. For more information, please visit our Permissions help page.