
Figures & data
Figure 1. Statistical analysis of IL-10 expression within colon cancer tissue. (A) Expression of IL-10 within all tissue types shows statistically significant increases in the cytokine within cancer tissue when compared with controls. ‘Adenocarcinoma IL-10 High’ tissue indicates tissues who had significant Il-10 expression and ‘Adenocarcinoma IL-10 Low’ tissue indicates tissue who had insignificant IL-10 expression. This same nomenclature is applied to the metastatic tissues. (B) All tissues [Adenocarcinoma IL-10 Low and Adenocarcinoma Il-10 High] were combined to determine the overall IL-10 expression within cancer grades. Overall, IL-10 expression had a significant increase in expression in Grade III tissue. (C) We found no statistically significant changes in IL-10 production between genders.
![Figure 1. Statistical analysis of IL-10 expression within colon cancer tissue. (A) Expression of IL-10 within all tissue types shows statistically significant increases in the cytokine within cancer tissue when compared with controls. ‘Adenocarcinoma IL-10 High’ tissue indicates tissues who had significant Il-10 expression and ‘Adenocarcinoma IL-10 Low’ tissue indicates tissue who had insignificant IL-10 expression. This same nomenclature is applied to the metastatic tissues. (B) All tissues [Adenocarcinoma IL-10 Low and Adenocarcinoma Il-10 High] were combined to determine the overall IL-10 expression within cancer grades. Overall, IL-10 expression had a significant increase in expression in Grade III tissue. (C) We found no statistically significant changes in IL-10 production between genders.](/cms/asset/b3253dda-9d13-4af0-8704-34e1b4855286/kcbt_a_1360453_f0001_oc.jpg)
Figure 2. IL-10 and TGF-β staining of colon adenocarcinoma tissue. Each tissue is displayed with the gray scale image, with an applied threshold, in the top right corner of the image. Below each image is the intensity map of the tissue with the gray values on the Y-axis. Within each of the intensity maps is a graphical representation of the level of gray staining. The scale bar indicates a magnification of 200. (A) Tissue from a 66-year-old female with Stage IIB colon adenocarcinoma who showed minimal levels of IL-10 expression characteristic of approximately 80% of patients. (B) Tissue from a 78-year-old female with stage III adenocarcinoma who experienced a significant upregulation of IL-10 within her tumor, which was characteristic of approximately 20% of the patients. (C) Tissue from a 64-year old male with stage III adenocarcinoma. This individual was rare among the samples analyzed as he had no visible staining of TGF-β. (D) Tissue from a 71-year old male with stage IIB adenocarcinoma, who had significant levels of TGF-β characteristic of only 13% of the tissues.
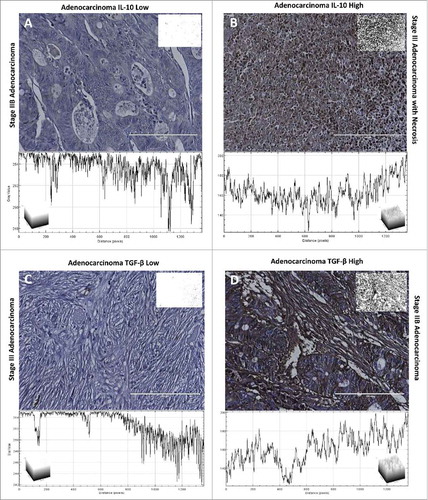
Figure 3. Statistical analysis of IL-10 expression within metastatic adenocarcinoma. (A) Within metastatic tissue there was no statistically significant increase in IL-10 presence with changes in grade. (B) While there were positive tissues within both adenocarcinoma and metastatic adenocarcinoma, patients with metastatic adenocarcinoma had a more prevalent presence of IL-10. (C) Along with an increase in the amount of patients with elevated IL-10 expression, the average stain intensity of patients with metastatic adenocarcinoma was significantly higher than patients with adenocarcinoma.
Figure 4. IL-10 and TGF-β expression within metastatic adenocarcinomas. Each tissue is displayed with the gray scale image, with an applied threshold, in the top right corner of the image. Below each image is the intensity map of the tissue with the gray values on the Y-axis. Within each of the intensity maps is a graphical representation of the level of gray staining. The scale bar indicates a magnification of 200. (A) Tissue from a 43-year-old male with grade 2 metastatic adenocarcinoma from the colon had minimal levels of IL-10 expression representative of 44% of patients. (B) Tissue from a 51-year-old female with metastatic adenocarcinoma who had significantly upregulated expression of IL-10 representative of 55% of tissue evaluated. (C) Tissue from a 58-year-old male with metastatic adenocarcinoma stained with TGF-β. All metastatic tissues exhibited this same level of TGF-β staining. This level of staining was consistent through all of the tissue types.
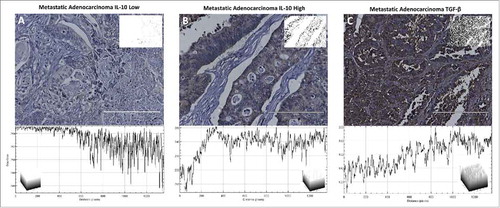
Figure 5. IL-10 and TGF-β expression profiles in patients from TCGA. (A) 396 metastatic tumors were analyzed for IL-10 expression. The number of patients is plotted against the Expression profile in transcripts per million. (B) IL-10 expression within primary and metastatic tumors was plotted to show differences within the same individual. On patient experienced significantly elevated IL-10 and is shown in green. This same cohort was used to also evaluate (C) TGF-β expression between primary and metastatic tumors.
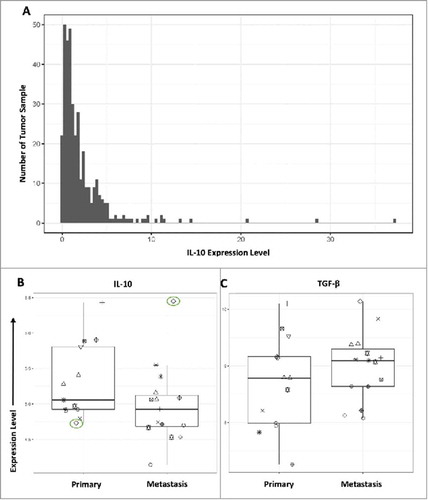
Figure 6. Statistical analysis of TGF-β expression within colon cancer tissue. (A) TGF-β showed a consistent level of expression across all tissue types, including normal tissue, with the exception of 4 patients who had insignificant levels of TGF-β expression. (B) Number of patients with positive expression of TGF-β and negative levels of TGF-β. There was a small proportion of patients that had no TGF-β expression. (C) There was no significant difference in TGF-β expression between tissue grades in colon adenocarcinoma samples or metastatic adenocarcinoma samples.
Table 1. Distribution of malignant colon tissue and controls.