Figures & data
Figure 1. Blockade of the phosphatidylinositol-3-kinase/mammalian target of rapamycin (PI3K/mTOR) pathway inhibits tumor-supportive processes in vitro. A, Endogenous PI3K/mTOR pathway activity was assessed by western blot analysis for total and activated (phosphorylated) protein kinase B (AKT), S6K, and 4EPB1 in whole cell lysates obtained from a panel of radiation-associated undifferentiated pleomorphic sarcoma (RA-UPS) and sporadic UPS cell strains and cell lines, with human mesenchymal stem cells (hMSCs) serving as the normal control. B, Representative western blots of whole cell lysates from a sporadic UPS cell line (UPS-186) and a RA-UPS cell line (RIS-819.1) after incubation with increasing concentrations of BGT226 for 2 hours. C, MTS assay results show diminished UPS-186 and RIS-819.1 cell proliferation relative to controls treated with dimethyl sulfoxide (DMSO) after 96 hours of BGT226 treatment, and the individual median effective concentrations (EC50) were determined. D Cell-cycle distribution (left) and apoptosis levels (right) were evaluated in the two UPS cell lines by fluorescence-activated cell sorting analysis after 48 or 96 hours of BGT226 treatment, respectively. DMSO, control. E, The effects of BGT226 on UPS-186 and RIS-819.1 cell migration and invasion were assessed by modified Boyden chamber assays. Representative images of cells treated with DMSO or BGT226 (100 nM) are displayed (magnification, 200 ×). The graphs depict the means of triplicate experiments; error bars are the standard errors of the mean. *p < 0.05; **p < 0.01; ***p < 0.001.
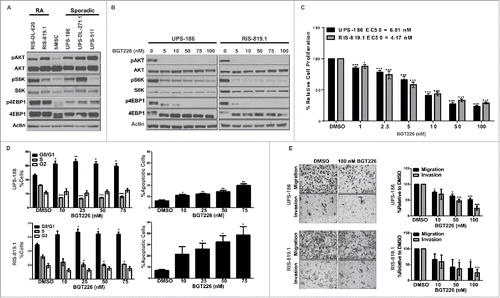
Figure 2. Daily administration of BGT226 reduces tumor volume and blocks PI3K/mTOR signaling and activates insulin-like growth factor 1 receptor (IGF1R) in vivo. A, Hairless severe combined immunodeficient mice harboring RIS-819.1 xenografts were treated with either vehicle (n = 6) or BGT226 (10 mg/kg or 15 mg/kg, n = 7 for both groups) daily via oral gavage; tumor volumes were measured three times per week. The red arrow indicates the change in the treatment schedule for the 15-mg/kg BGT226 group (from 7 days/week to 5 days/week). Values displayed are the mean volumes ± the standard error of the mean (*p < 0.05). B, Representative photographs (magnification, 200 ×) of immunohistochemical analysis performed on RIS-819.1 xenografts from vehicle- and BGT226-treated mice for markers of proliferation (Ki67), of apoptosis (cleaved caspase 3 [CC3]), and of PI3K/mTOR activity (pAKT, pS6RP, and p4EBP1). H&E: hematoxylin and eosin stain. C, Detection of IGF1R activation (phosphorylated IGF1R [pIGF1R]) in vehicle and BGT226-treated xenografts via immunohistochemical analysis (upper panel; magnification, 200 ×) and western blot analysis (lower panel).
![Figure 2. Daily administration of BGT226 reduces tumor volume and blocks PI3K/mTOR signaling and activates insulin-like growth factor 1 receptor (IGF1R) in vivo. A, Hairless severe combined immunodeficient mice harboring RIS-819.1 xenografts were treated with either vehicle (n = 6) or BGT226 (10 mg/kg or 15 mg/kg, n = 7 for both groups) daily via oral gavage; tumor volumes were measured three times per week. The red arrow indicates the change in the treatment schedule for the 15-mg/kg BGT226 group (from 7 days/week to 5 days/week). Values displayed are the mean volumes ± the standard error of the mean (*p < 0.05). B, Representative photographs (magnification, 200 ×) of immunohistochemical analysis performed on RIS-819.1 xenografts from vehicle- and BGT226-treated mice for markers of proliferation (Ki67), of apoptosis (cleaved caspase 3 [CC3]), and of PI3K/mTOR activity (pAKT, pS6RP, and p4EBP1). H&E: hematoxylin and eosin stain. C, Detection of IGF1R activation (phosphorylated IGF1R [pIGF1R]) in vehicle and BGT226-treated xenografts via immunohistochemical analysis (upper panel; magnification, 200 ×) and western blot analysis (lower panel).](/cms/asset/05d419da-3e25-42e1-b3da-b26f62bdd1af/kcbt_a_1373230_f0002_oc.gif)
Figure 3. IGF1R activation in response to BGT226-mediated PI3K/mTOR blockade is attenuated by AEW541. A, Detection of phosphorylated IGF1R (pIGF1R) and total IGF1R in undifferentiated pleomorphic sarcoma (UPS) cell lines incubated with BGT226 for 2 hours. B, UPS-186 and RIS-819.1 cells pre-treated with increasing concentrations of AEW541 and then stimulated with IGF1 (20 ng/mL) were subjected to western blot analysis. C, UPS cell proliferation decreased in the presence of AEW541 + IGF1 (20 ng/mL) relative to controls treated with dimethyl sulfoxide (DMSO). D, AEW541 treatment caused cells to accumulate in the G1 phase of the cell cycle and induced apoptosis. DMSO, control in the presence of 20ng/mL IGF1. E, Incubation with AEW541 for 16 hours reduced UPS cell migration and invasion. Representative images of cells treated with DMSO, DMSO + IGF1 (100 ng/mL), or AEW541 (5 µM) + IGF1 (100 ng/mL; magnification: 200 ×). The graphical representations of the data are the means of triplicate experiments; error bars are the standard errors of the mean. *p < 0.05; **p < 0.01; ***p < 0.001.
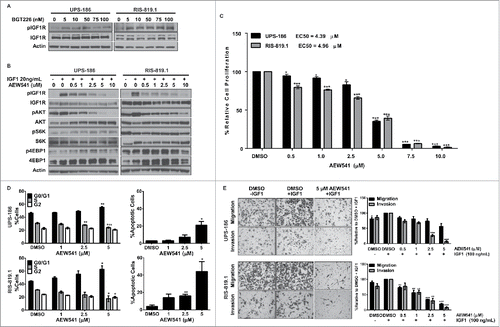
Figure 4. BGT226 and AEW541 act synergistically to block PI3K/mTOR signaling and IGF1R activation in vitro. A, Combination index (CI) values (top) were calculated using CompuSyn software, and drug effect percentages ([1 – relative cell proliferation] × 100%; bottom) were obtained for undifferentiated pleomorphic sarcoma (UPS) cell lines UPS-186 and RIS-819.1 using MTS results in triplicate. B, Effects on IGF1R and effector molecules of PI3K/mTOR signaling in the same cells were determined by western blot analysis following co-treatment with AEW541 and BGT226 and subsequent stimulation with recombinant IGF1.
![Figure 4. BGT226 and AEW541 act synergistically to block PI3K/mTOR signaling and IGF1R activation in vitro. A, Combination index (CI) values (top) were calculated using CompuSyn software, and drug effect percentages ([1 – relative cell proliferation] × 100%; bottom) were obtained for undifferentiated pleomorphic sarcoma (UPS) cell lines UPS-186 and RIS-819.1 using MTS results in triplicate. B, Effects on IGF1R and effector molecules of PI3K/mTOR signaling in the same cells were determined by western blot analysis following co-treatment with AEW541 and BGT226 and subsequent stimulation with recombinant IGF1.](/cms/asset/cff614e5-144a-4267-9450-612d68ac57b1/kcbt_a_1373230_f0004_oc.gif)
Figure 5. Combined inhibition of PI3K/mTOR and IGF1R signaling results in stable disease in vivo. A, Tumor volumes of RIS-819.1 xenografts treated with vehicle (n = 7), BGT226 (10 mg/kg, n = 7), AEW541 (40 mg/kg, n = 6), or a combination of BGT226 and AEW541 (n = 6) daily (5 days/week for approximately 3 weeks) are presented as mean ± the standard error of the mean. B, Representative images show control and inhibitor-treated xenografts that were subjected to immunohistochemical analysis for protein markers of cell proliferation (Ki67), apoptotic cell death (cleaved caspase 3 [CC3]), and target inhibition (pAKT, pS6RP, p4EBP1, phosphorylated insulin-like growth factor 1 receptor [pIGF1R], p27, and CD31; magnification, 200 ×). H&E: hematoxylin and eosin stain. *p < 0.05; **p < 0.01.
![Figure 5. Combined inhibition of PI3K/mTOR and IGF1R signaling results in stable disease in vivo. A, Tumor volumes of RIS-819.1 xenografts treated with vehicle (n = 7), BGT226 (10 mg/kg, n = 7), AEW541 (40 mg/kg, n = 6), or a combination of BGT226 and AEW541 (n = 6) daily (5 days/week for approximately 3 weeks) are presented as mean ± the standard error of the mean. B, Representative images show control and inhibitor-treated xenografts that were subjected to immunohistochemical analysis for protein markers of cell proliferation (Ki67), apoptotic cell death (cleaved caspase 3 [CC3]), and target inhibition (pAKT, pS6RP, p4EBP1, phosphorylated insulin-like growth factor 1 receptor [pIGF1R], p27, and CD31; magnification, 200 ×). H&E: hematoxylin and eosin stain. *p < 0.05; **p < 0.01.](/cms/asset/79c1100d-ace4-4322-a239-cedd66058fc0/kcbt_a_1373230_f0005_oc.gif)
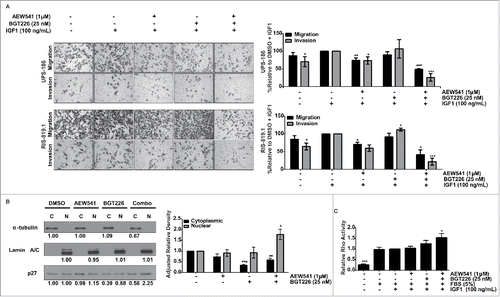
Figure 6. Reduction of migration and invasion after co-treatment is associated with localization of p27 to the nucleus and increased Ras homolog family member A (RhoA) activity. A, A combination of AEW541 and BGT226 reduced undifferentiated pleomorphic sarcoma (UPS) cell migration and invasion according to modified Boyden chamber assay results. B, p27 localization was determined by nuclear (N) and cytoplasmic (C) fractionation of cell lysates (right panel) cells were subjected to immunoblot analysis (left panel), and relative p27 protein levels were calculated using densitometry using α-tublin as the cytoplasmic loading control and lamin A/C as the nuclear loading control. Fraction purity was assessed by α-tubulin (cytoplasmic) and lamin A/C (nuclear). C, The effect of the combination treatment on RhoA activity was assayed. RhoA activity relative to the fetal bovine serum/insulin-like growth factor 1 receptor (FBS/IGF1)-stimulated control is displayed. *p < 0.05; **p < 0.01; ***p < 0.001.