2,662
Views
1
CrossRef citations to date
0
Altmetric
Research Papers

Some chemotherapeutics-treated colon cancer cells display a specific phenotype being a combination of stem-like and senescent cell features

, , , , , & show all
Pages 63-75 | Received 07 Dec 2016, Accepted 24 Sep 2017, Published online: 22 Dec 2017

Figures & data

Figure 1. Kinetics of colon cancer cell re-population after chemotherapeutics withdrawal is a drug-specific. Experimental protocols. A. LONG CHEMO protocol. HCT116 cells were subjected to six cycles of chemotherapeutics as follows: cells were treated with 5 μM OXA, 100 nM DOXO, 50 μM 5-FU or 2.5 μM IRINO for 24 hours, then a medium was removed and cells were cultured in a drug-free medium for the next 3 days. B. AFTER CHEMO protocol. After 3rd drug treatment HCT116 cells were cultured in a drug-free medium for additional 14 days. C. Evaluation of cell number at various time points after drug treatment (AFTER CHEMO). DOXO at 100 nM concentration was used as a reference drug inducing senescence and after withdrawal – senescence escape.Citation25 D. Visualization of spheres formed by untreated and chemotherapeutics-treated cells. AFTER CHEMO-treated cells (1 000 cells/96-well plate) were harvested and seeded on the 14th day into matrigel. Representative photos were taken three weeks after seeding with light microscopy (100x magnification). E. Numbers of spheres formed by untreated or AFTER CHEMO-treated cells. F. Evaluation of size of spheres formed by untreated or AFTER CHEMO-treated cells. Each bar represents mean ± SEM, N≥3; statistical significance # – p < 0,05, ## – p < 0,01, ### – p < 0,001 – LONG CHEMO vs. AFTER CHEMO, *– p < 0,05, **– p < 0,01,>> ***– p < 0,001–untreated vs. AFTER CHEMO.
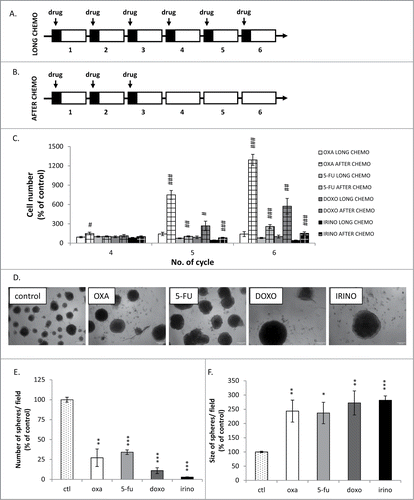
Figure 1. Kinetics of colon cancer cell re-population after chemotherapeutics withdrawal is a drug-specific. Experimental protocols. A. LONG CHEMO protocol. HCT116 cells were subjected to six cycles of chemotherapeutics as follows: cells were treated with 5 μM OXA, 100 nM DOXO, 50 μM 5-FU or 2.5 μM IRINO for 24 hours, then a medium was removed and cells were cultured in a drug-free medium for the next 3 days. B. AFTER CHEMO protocol. After 3rd drug treatment HCT116 cells were cultured in a drug-free medium for additional 14 days. C. Evaluation of cell number at various time points after drug treatment (AFTER CHEMO). DOXO at 100 nM concentration was used as a reference drug inducing senescence and after withdrawal – senescence escape.Citation25 D. Visualization of spheres formed by untreated and chemotherapeutics-treated cells. AFTER CHEMO-treated cells (1 000 cells/96-well plate) were harvested and seeded on the 14th day into matrigel. Representative photos were taken three weeks after seeding with light microscopy (100x magnification). E. Numbers of spheres formed by untreated or AFTER CHEMO-treated cells. F. Evaluation of size of spheres formed by untreated or AFTER CHEMO-treated cells. Each bar represents mean ± SEM, N≥3; statistical significance # – p < 0,05, ## – p < 0,01, ### – p < 0,001 – LONG CHEMO vs. AFTER CHEMO, *– p < 0,05, **– p < 0,01,>> ***– p < 0,001–untreated vs. AFTER CHEMO.

Figure 2. There are no differences in terms of cell death and proliferation after chemotherapeutics treatment. HCT116 cells were treated with LONG CHEMO protocol. A. Evaluation of cell mortality, performed using LDH assay. B. Representative blot shows expression of PARP-1. Cleaved form of PARP-1 (89 kDa) is the hallmark of apoptosis. GAPDH or ACTIN was used as a loading control. C. Fractions of cells in S phase, quantified with PI staining and flow cytometry. D. Fractions of KI67 positive cells. E. Representative photos show KI67 staining in untreated and OXA-, 5-FU-, DOXO- or IRINO-treated HCT116 cells: KI67 visualized as green (AlexaFluor 488), and nuclei visualized as grey (H33342). KI67+ polyploid cells indicated with white arrows. Data obtained with fluorescence microscopy (200x magnification) at the end of the 5th cycle of LONG CHEMO protocol. Scale bar – 100μm. Each bar represents mean ± SEM, N≥3; statistical significance * – p < 0,05, ** – p < 0,01, *** – p < 0,001 – untreated vs. LONG CHEMO.
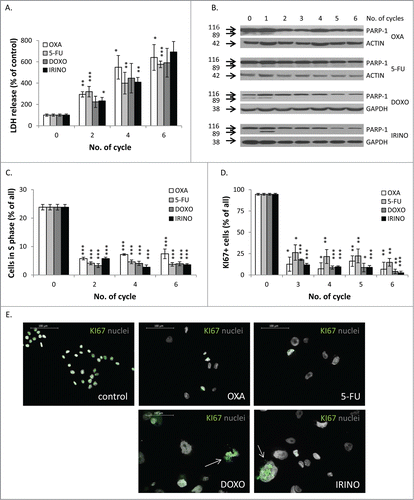
Figure 2. There are no differences in terms of cell death and proliferation after chemotherapeutics treatment. HCT116 cells were treated with LONG CHEMO protocol. A. Evaluation of cell mortality, performed using LDH assay. B. Representative blot shows expression of PARP-1. Cleaved form of PARP-1 (89 kDa) is the hallmark of apoptosis. GAPDH or ACTIN was used as a loading control. C. Fractions of cells in S phase, quantified with PI staining and flow cytometry. D. Fractions of KI67 positive cells. E. Representative photos show KI67 staining in untreated and OXA-, 5-FU-, DOXO- or IRINO-treated HCT116 cells: KI67 visualized as green (AlexaFluor 488), and nuclei visualized as grey (H33342). KI67+ polyploid cells indicated with white arrows. Data obtained with fluorescence microscopy (200x magnification) at the end of the 5th cycle of LONG CHEMO protocol. Scale bar – 100μm. Each bar represents mean ± SEM, N≥3; statistical significance * – p < 0,05, ** – p < 0,01, *** – p < 0,001 – untreated vs. LONG CHEMO.
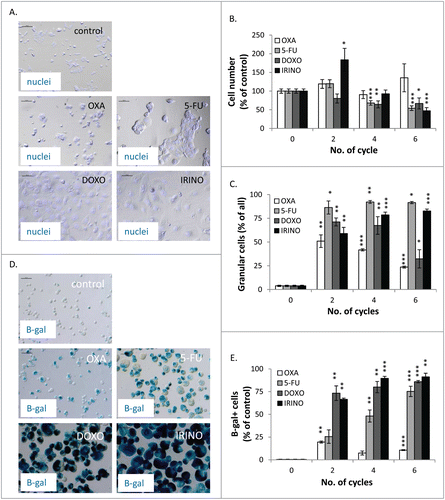
Figure 3. DOXO and IRINO are the strongest inducers of cellular senescence and activate its hallmarks: growth arrest, and an increase in size, granularity and SA-β-gal positivity. HCT116 cells were treated with LONG CHEMO protocol. A. Representative photos showing morphological alterations in OXA-, 5-FU-, DOXO- or IRINO-treated HCT116 cells. Cell nuclei were stained with H33342 dye (blue). Data acquired using fluorescence and transmitted light microscopy (200x magnification) at the end of the 5th cycle of LONG CHEMO protocol. Scale bar – 100μm. B. Evaluation of cell number at several time points after drug treatment. Cell were counted in Bürker's chamber. C. Fraction of granular cells as determined by FSC/SSC analysis, using flow cytometry. D. Representative photos of SA-β-gal staining on untreated and treated cells. Staining was performed on cytospined cells to enable easier quantification of SA-β-gal positive cells. Scale bar – 100μm. Data obtained with transmitted light microscopy (200x magnification) at the end of the 5th cycle of LONG CHEMO protocol. E. Fractions of SA-β-gal+ cells. Each bar represents mean ± SEM, N≥3; statistical significance * – p < 0,05, ** – p < 0,01, *** – p < 0,001 – untreated vs. LONG CHEMO.
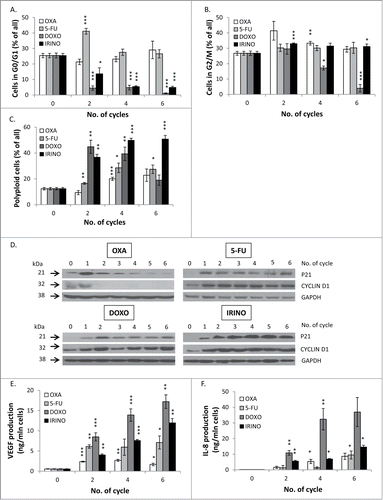
Figure 3. DOXO and IRINO are the strongest inducers of cellular senescence and activate its hallmarks: growth arrest, and an increase in size, granularity and SA-β-gal positivity. HCT116 cells were treated with LONG CHEMO protocol. A. Representative photos showing morphological alterations in OXA-, 5-FU-, DOXO- or IRINO-treated HCT116 cells. Cell nuclei were stained with H33342 dye (blue). Data acquired using fluorescence and transmitted light microscopy (200x magnification) at the end of the 5th cycle of LONG CHEMO protocol. Scale bar – 100μm. B. Evaluation of cell number at several time points after drug treatment. Cell were counted in Bürker's chamber. C. Fraction of granular cells as determined by FSC/SSC analysis, using flow cytometry. D. Representative photos of SA-β-gal staining on untreated and treated cells. Staining was performed on cytospined cells to enable easier quantification of SA-β-gal positive cells. Scale bar – 100μm. Data obtained with transmitted light microscopy (200x magnification) at the end of the 5th cycle of LONG CHEMO protocol. E. Fractions of SA-β-gal+ cells. Each bar represents mean ± SEM, N≥3; statistical significance * – p < 0,05, ** – p < 0,01, *** – p < 0,001 – untreated vs. LONG CHEMO.

Figure 4. DOXO and IRINO are the strongest inducers of cellular senescence and activate its hallmarks: alternations of cell cycle, and an increase in expression levels of P21 and CYCLIN D1 as well as secretory phenotype. HCT116 cells were treated with LONG CHEMO protocol. Fractions of HCT116 cells in different phases of cell cycle after OXA, 5-FU, DOXO or IRINO treatment: A. G0/G1, B. G2/M and C. Fractions of polyploid cells. Cell cycle analysis was performed using PI staining and flow cytometry. D. Representative blots show expression levels of: P21 and CYCLIN D1 in OXA-, 5-FU-, DOXO- or IRINO-treated cells. GAPDH detection was used as a loading control. Secretion of E. VEGF and F. IL-8 in OXA-, 5-FU-, DOXO- or IRINO-treated HCT116 cultures. Cytokine levels were determined in supernatants harvested from untreated and treated cells by colorimetric ELISA. Results were normalized to total cell number counted in Bürker's chamber. Each bar represents mean ± SEM, N≥3; statistical significance * – p < 0,05, ** – p < 0,01, *** – p < 0,001 – untreated vs. LONG CHEMO.

Figure 4. DOXO and IRINO are the strongest inducers of cellular senescence and activate its hallmarks: alternations of cell cycle, and an increase in expression levels of P21 and CYCLIN D1 as well as secretory phenotype. HCT116 cells were treated with LONG CHEMO protocol. Fractions of HCT116 cells in different phases of cell cycle after OXA, 5-FU, DOXO or IRINO treatment: A. G0/G1, B. G2/M and C. Fractions of polyploid cells. Cell cycle analysis was performed using PI staining and flow cytometry. D. Representative blots show expression levels of: P21 and CYCLIN D1 in OXA-, 5-FU-, DOXO- or IRINO-treated cells. GAPDH detection was used as a loading control. Secretion of E. VEGF and F. IL-8 in OXA-, 5-FU-, DOXO- or IRINO-treated HCT116 cultures. Cytokine levels were determined in supernatants harvested from untreated and treated cells by colorimetric ELISA. Results were normalized to total cell number counted in Bürker's chamber. Each bar represents mean ± SEM, N≥3; statistical significance * – p < 0,05, ** – p < 0,01, *** – p < 0,001 – untreated vs. LONG CHEMO.

Figure 5. Some senescent HCT116 cells show elevated NANOG expression. HCT116 cells were treated with LONG CHEMO protocol. A. Representative blot shows the expression of NANOG in OXA-, 5-FU-, DOXO- or IRINO-treated HCT116 cultures. Membranes were re-probed with anti-GAPDH antibodies, which were used as loading controls. B. Representative photos show NANOG staining in untreated, OXA-, 5-FU-, DOXO- or IRINO-treated HCT116 cells: NANOG visualized as red (AlexaFluor 555), and nuclei visualized as blue (H33342). Nucelar NANOG localization in polyploid cells indicated with white arrows. Cytoplasmic NANOG localization in polyploid cells indicated with white arrowheads. Data obtained with fluorescent microscopy (200x magnification) at the end of 5th cycle of LONG CHEMO protocol. Scale bar – 100μm.
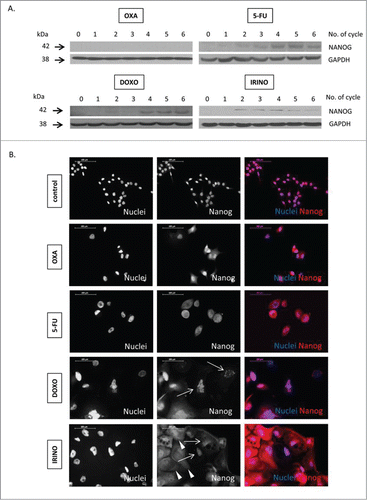
Figure 5. Some senescent HCT116 cells show elevated NANOG expression. HCT116 cells were treated with LONG CHEMO protocol. A. Representative blot shows the expression of NANOG in OXA-, 5-FU-, DOXO- or IRINO-treated HCT116 cultures. Membranes were re-probed with anti-GAPDH antibodies, which were used as loading controls. B. Representative photos show NANOG staining in untreated, OXA-, 5-FU-, DOXO- or IRINO-treated HCT116 cells: NANOG visualized as red (AlexaFluor 555), and nuclei visualized as blue (H33342). Nucelar NANOG localization in polyploid cells indicated with white arrows. Cytoplasmic NANOG localization in polyploid cells indicated with white arrowheads. Data obtained with fluorescent microscopy (200x magnification) at the end of 5th cycle of LONG CHEMO protocol. Scale bar – 100μm.

Figure 6. Senescent HCT116 cells show an increase in side population and fraction of CD24-positive, but reduced fraction of CD44-positive cells and decreased EMT. HCT116 cells were treated with LONG CHEMO protocol. A. Detection of cells excluding H33342. Cells treated with OXA-, 5-FU-, DOXO- or IRINO were stained with H33342 and analyzed by flow cytometry. Fractions of: B. CD24, C. CD44 or D. CD133 positive cells. Cells were probed with anti-CD24-FITC, anti-CD133-APC or anti-CD44-AlexaFluor700 antibodies and percentage of positive cells were determined using flow cytometry. Cells labeled with and isotypic IgGs were used as a negative control. E. The expression of epithelial to mesenchymal (EMT) markers in: OXA-, 5-FU-, DOXO- or IRINO-treated cells. Representative blots show expression levels of: E-CADHERIN and SNAIL. GAPDH detection was used as a loading control. Each bar represents mean ± SEM, N≥3; statistical significance * – p < 0,05, ** – p<0,01, *** – p<0,001 – untreated vs. LONG CHEMO.
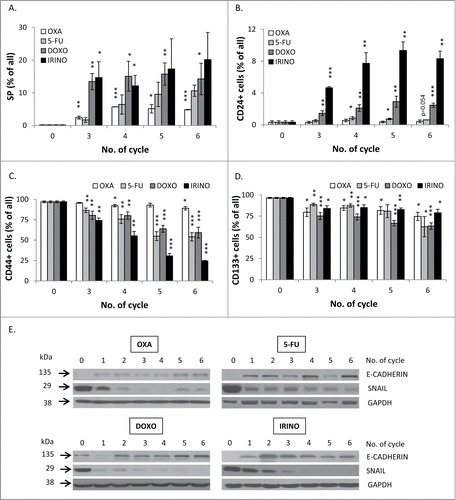
Figure 6. Senescent HCT116 cells show an increase in side population and fraction of CD24-positive, but reduced fraction of CD44-positive cells and decreased EMT. HCT116 cells were treated with LONG CHEMO protocol. A. Detection of cells excluding H33342. Cells treated with OXA-, 5-FU-, DOXO- or IRINO were stained with H33342 and analyzed by flow cytometry. Fractions of: B. CD24, C. CD44 or D. CD133 positive cells. Cells were probed with anti-CD24-FITC, anti-CD133-APC or anti-CD44-AlexaFluor700 antibodies and percentage of positive cells were determined using flow cytometry. Cells labeled with and isotypic IgGs were used as a negative control. E. The expression of epithelial to mesenchymal (EMT) markers in: OXA-, 5-FU-, DOXO- or IRINO-treated cells. Representative blots show expression levels of: E-CADHERIN and SNAIL. GAPDH detection was used as a loading control. Each bar represents mean ± SEM, N≥3; statistical significance * – p < 0,05, ** – p<0,01, *** – p<0,001 – untreated vs. LONG CHEMO.

Figure 7. Some of polyploid HCT116 show ZEB-1 positivity and blastocyst-like morphology. HCT116 cells were treated with LONG CHEMO protocol. A. and B. Representative photos show ZEB-1 staining in untreated, DOXO- or IRINO-treated HCT116 cells: ZEB-1 visualized as red (AlexaFluor 555), and nuclei visualized as blue (H33342). ZEB-1 localization in nuclei of polyploid cells indicated by white arrows. Data obtained with fluorescent microscopy (200x magnification) at the end of 3rd or 5th cycle of LONG CHEMO protocol. Scale bar – 100μm. C. Polyploid cells show blastocyst-like morphology. These forms, indicated here by black arrows, consist of big, round, floating body and group of cells resembling inner cell mass inside their cavities. D. Polyploid cells with blastocyst-like morphology seem to be a source of progeny, that exhibit collective way of migration. Polyploid cells with blastocyst-like morphology are indicated by black arrows, whereas progeny migrating in collective way are indicated by white arrowheads. Cells were seeded in 6-well plate and treated with the AFTER CHEMO protocol. Cells had being recorded starting from the indicated day. Pictures were taken every 10 minutes for the next 48 hours using time-lapse microscopy in DIC Nomarski contrast mode, at 200x magnification. Nuclei visualized as blue (H33342).
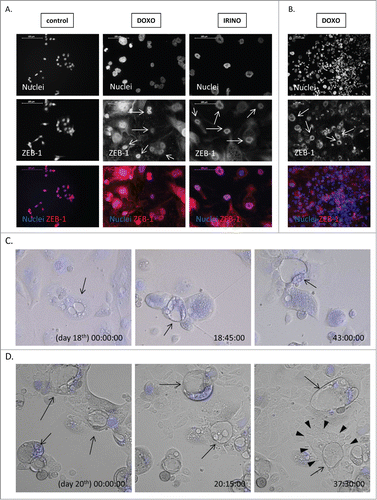
Figure 7. Some of polyploid HCT116 show ZEB-1 positivity and blastocyst-like morphology. HCT116 cells were treated with LONG CHEMO protocol. A. and B. Representative photos show ZEB-1 staining in untreated, DOXO- or IRINO-treated HCT116 cells: ZEB-1 visualized as red (AlexaFluor 555), and nuclei visualized as blue (H33342). ZEB-1 localization in nuclei of polyploid cells indicated by white arrows. Data obtained with fluorescent microscopy (200x magnification) at the end of 3rd or 5th cycle of LONG CHEMO protocol. Scale bar – 100μm. C. Polyploid cells show blastocyst-like morphology. These forms, indicated here by black arrows, consist of big, round, floating body and group of cells resembling inner cell mass inside their cavities. D. Polyploid cells with blastocyst-like morphology seem to be a source of progeny, that exhibit collective way of migration. Polyploid cells with blastocyst-like morphology are indicated by black arrows, whereas progeny migrating in collective way are indicated by white arrowheads. Cells were seeded in 6-well plate and treated with the AFTER CHEMO protocol. Cells had being recorded starting from the indicated day. Pictures were taken every 10 minutes for the next 48 hours using time-lapse microscopy in DIC Nomarski contrast mode, at 200x magnification. Nuclei visualized as blue (H33342).
Supplemental material

Sup_Mat_1385675_Movie_1.docx

Download MS Word (13.2 KB)

supp_mat_1385675.zip

Download Zip (30.5 MB)

supp_mat_1385675.zip

Download Zip (26.5 MB)

Reprints and Corporate Permissions

Please note: Selecting permissions does not provide access to the full text of the article, please see our help page How do I view content?

To request a reprint or corporate permissions for this article, please click on the relevant link below:

Academic Permissions

Please note: Selecting permissions does not provide access to the full text of the article, please see our help page How do I view content?

Obtain permissions instantly via Rightslink by clicking on the button below:

If you are unable to obtain permissions via Rightslink, please complete and submit this Permissions form. For more information, please visit our Permissions help page.