Figures & data
Figure 1. Cytotoxicity of light (A, D), MPPa (B, E) or DDP (C, F) on A549 and A549/DDP (A‒C), and SKOV3 and SKOV3/DDP (D‒F) cells. Light or MPPa alone caused no cytotoxicity; DDP led to a less percentage of survival cells in A549/DDP or SKOV3/DDP, compared with A549 or SKOV3 cells. Data were mean ± standard deviation for 3 independent experiments.
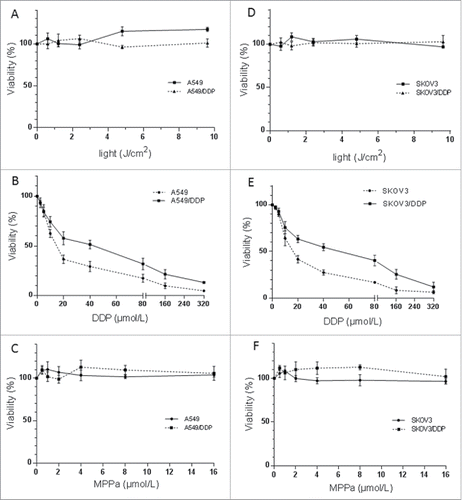
Figure 2. Cytotoxicity of the combination of MPPa and light (i.e., PDT) on A549 (A), A549/DDP (B), SKOV3 (C), and SKOV3/DDP (D) cells. Based on the cell-survival curve, 2.4 J/cm2 light and 2.0 μM MPPa were employed to perform PDT. Data were mean ± standard deviation for 3 independent experiments.
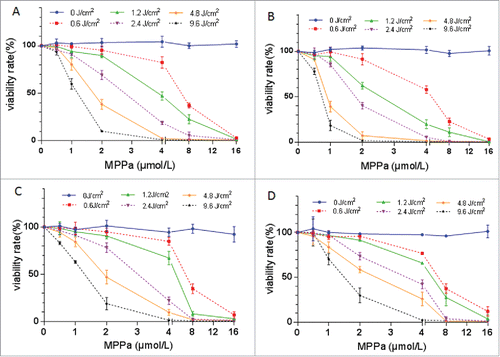
Figure 3. Percentages of dead cells in A549 and A549/DDP (A), and SKOV3 and SKOV3/DDP (B) cells. PDT or DDP deactivated cells, and the highest cell-death fraction was detected in group PDT + DDP in 4 cell lines. Data were mean ± standard deviation for 3 independent experiments. *: vs. group Ctrl, p < 0.05; &: vs. group DDP, p < 0.05; #: vs. group PDT, p < 0.05.
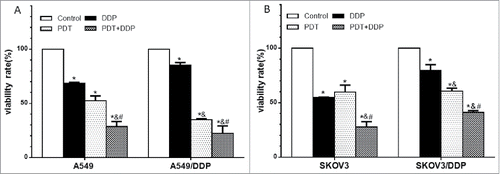
Figure 4. Apoptosis in A549 and A549/DDP (A), and SKOV3 and SKOV3/DDP (B) cells. PDT induced apoptosis in 4 cell lines, DDP exposure increased the percentage of apoptotic cells in A549 and SKOV3 cells, and the highest apoptotic rate was noted in group PDT + DDP in 4 cell lines. Data were mean ± standard deviation for 3 independent experiments. *: vs. group Ctrl, p < 0.05; &: vs. group DDP, p < 0.05; #: vs. group PDT, p < 0.05.
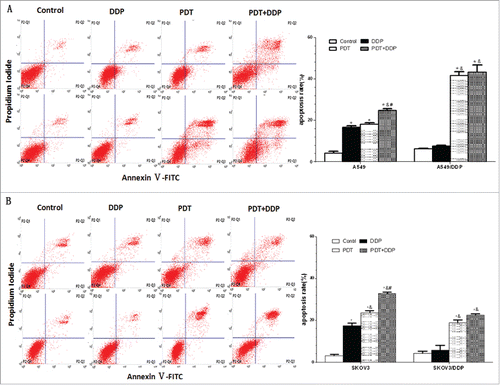
Figure 5. Intracellular level of ROS in A549 and A549/DDP (A), and SKOV3 and SKOV3/DDP (B) cells. PDT increased the level in 4 cell lines, but DDP increased the level in only A549 and SKOV3 cells; the highest ROS level occurred in group PDT + DDP in 4 cell lines. Data were mean ± standard deviation for 3 independent experiments. *: vs. group Ctrl, p < 0.05; &: vs. group DDP, p < 0.05; #: vs. group PDT, p < 0.05.
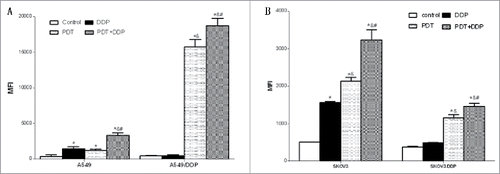
Figure 6. Intracellular localization of MPPa. Red fluorescence indicated MPPa and green fluorescence showed mitochondria; orange appeared in the merged image, demonstrating that MPPa located in mitochondria (×200).
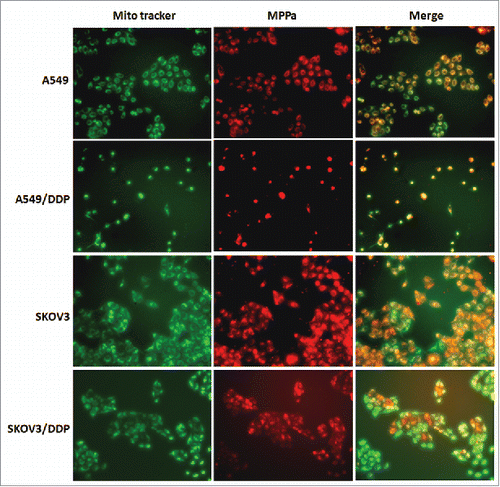
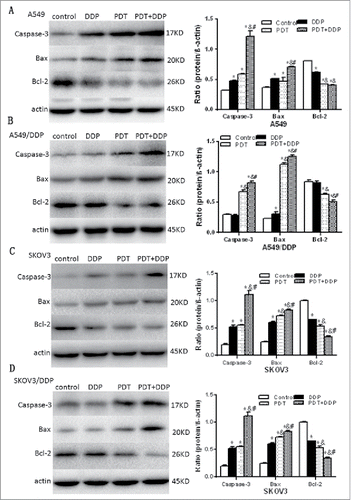
Figure 7. Cleaved caspase 3, Bax and Bcl-2 proteins validated by western blot, in A549 and A549/DDP (A, B), and SKOV3 and SKOV3/DDP (C, D) cells. In 4 cell lines, caspase 3 and Bax were increased and Bcl-2 decreased, in groups PDT and PDT + DDP, demonstrating the occurrence of apoptosis. However, Bcl-2/Bax/caspase 3 was not altered in group DDP, in A549/DDP and SKOV3/DDP cells, indicating the malfunction of apoptosis. Data were mean ± standard deviation for 3 independent experiments. *: vs. group Ctrl, p < 0.05; &: vs. group DDP, p < 0.05; #: vs. group PDT, p < 0.05.