1,266
Views
0
CrossRef citations to date
0
Altmetric
Research Papers

FGFR1 signaling potentiates tumor growth and predicts poor prognosis in esophageal squamous cell carcinoma patients

, , , , , , , , , , & show all
Pages 76-86 | Received 14 Jun 2017, Accepted 15 Oct 2017, Published online: 19 Dec 2017

Figures & data

Table 1. Association between FGFR1 m-RNA expression and clinicopathological data of patients with ESCC.

Table 2. Univariate analyses of OS and DFS in ESCC patients.

Table 3. Multivariate analyses of OS and DFS in ESCC patients.

Figure 1. High gene expression of FGFR1 predicts poor OS in ESCC patients. Kaplan–Meier plots of the association of FGFR1 mRNA expression with OS (a) and DFS (b) in ESCC patients. P-values are verified by the log-rank test.
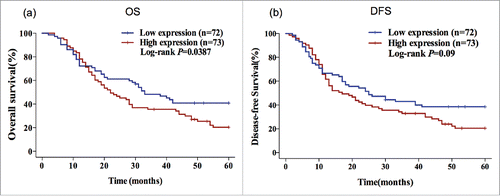
Figure 1. High gene expression of FGFR1 predicts poor OS in ESCC patients. Kaplan–Meier plots of the association of FGFR1 mRNA expression with OS (a) and DFS (b) in ESCC patients. P-values are verified by the log-rank test.

Figure 2. FGFR1 is over-expressed in ESCC cell lines. mRNA expression (a) and protein expression (b) of normal human esophageal mucosa cell line (Het-1A) and eight human esophageal carcinoma cell lines including KYSE-30, KYSE-180, ECA109, EC706 and TE series (TE-1, 3, 8). Data are presented as the mean ± SD; *P < 0.05 significantly different compared to each other.
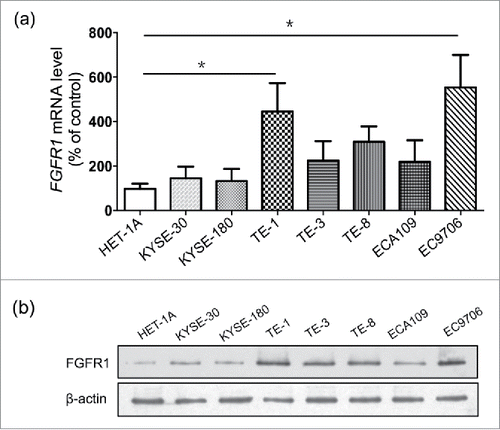
Figure 2. FGFR1 is over-expressed in ESCC cell lines. mRNA expression (a) and protein expression (b) of normal human esophageal mucosa cell line (Het-1A) and eight human esophageal carcinoma cell lines including KYSE-30, KYSE-180, ECA109, EC706 and TE series (TE-1, 3, 8). Data are presented as the mean ± SD; *P < 0.05 significantly different compared to each other.

Figure 3. Anti-FGFR1 affects the proliferation of ESCC cells expressing high FGFR1. (a) Cell viability of TE-1, EC9706, KYSE-30 and KYSE-180 with treatment of PD173074 (0.1 μM, 0.5 μM) or DMSO detecting by MTT at 24, 48, 72, and 96 hours; (b) Representative images of colony formation assays of TE-1, EC9706, KYSE-30 and KYSE-180 with treatment of PD173074 (0.1 μM, 0.5 μM) or DMSO for 14 days. (Data are presented as the mean ± SD; *P < 0.05, **P < 0.01, ***P < 0.001 significantly different compared to control group.
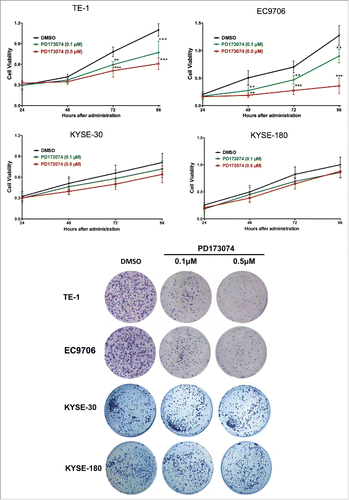
Figure 3. Anti-FGFR1 affects the proliferation of ESCC cells expressing high FGFR1. (a) Cell viability of TE-1, EC9706, KYSE-30 and KYSE-180 with treatment of PD173074 (0.1 μM, 0.5 μM) or DMSO detecting by MTT at 24, 48, 72, and 96 hours; (b) Representative images of colony formation assays of TE-1, EC9706, KYSE-30 and KYSE-180 with treatment of PD173074 (0.1 μM, 0.5 μM) or DMSO for 14 days. (Data are presented as the mean ± SD; *P < 0.05, **P < 0.01, ***P < 0.001 significantly different compared to control group.

Figure 4. Anti-FGFR1 arrests ESCC tumor growth in vivo and attenuates the MAPK/ERK signaling pathway. (a) Antitumor effect of anti-FGFR1 treatment. Nude mice model established with TE-1 or EC9706 cells were treated orally with PD173074 at a dose of 50 or 100 mg/kg or with vehicle alone twice daily for 20 days. Data are presented as the mean ± SD; *P < 0.05, **P < 0.01, ***P < 0.001 significantly different compared to vehicle group. (b) The effect of anti-FGFR1 therapy on FGFR1, ERK, AKT, S6 and STAT1 phosphorylation detecting by western blotting.
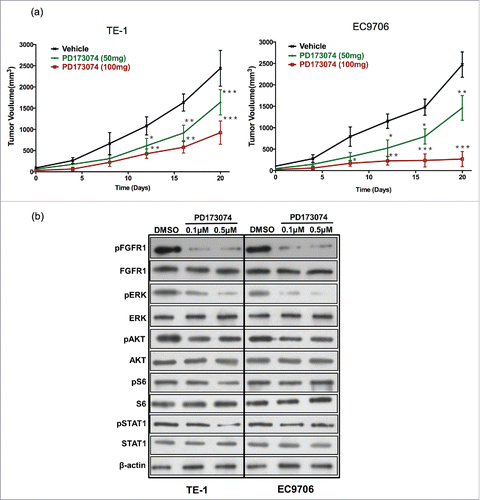
Figure 4. Anti-FGFR1 arrests ESCC tumor growth in vivo and attenuates the MAPK/ERK signaling pathway. (a) Antitumor effect of anti-FGFR1 treatment. Nude mice model established with TE-1 or EC9706 cells were treated orally with PD173074 at a dose of 50 or 100 mg/kg or with vehicle alone twice daily for 20 days. Data are presented as the mean ± SD; *P < 0.05, **P < 0.01, ***P < 0.001 significantly different compared to vehicle group. (b) The effect of anti-FGFR1 therapy on FGFR1, ERK, AKT, S6 and STAT1 phosphorylation detecting by western blotting.

Figure 5. PD173074 inhibits the signal pathway downstream of FGFR1 in ESCC. Ligand (eg. FGF) binds to FGFR1 and trigger the phosphorylation of FGFR1 tyrosine kinase domains leading the activation of three main downstream pathways: 1) RAS-RAF-MAPK-ERK; 2) PI3K-AKT-mTOR-p70-S6; 3) JAK-STAT-p21; FGFR1 selective inhibitor PD173034 inhibits the phosphorylation of its tyrosine kinase domains thus inhibiting downstream signaling pathway.
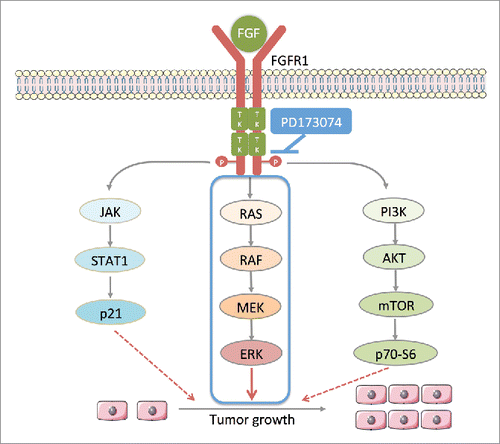
Figure 5. PD173074 inhibits the signal pathway downstream of FGFR1 in ESCC. Ligand (eg. FGF) binds to FGFR1 and trigger the phosphorylation of FGFR1 tyrosine kinase domains leading the activation of three main downstream pathways: 1) RAS-RAF-MAPK-ERK; 2) PI3K-AKT-mTOR-p70-S6; 3) JAK-STAT-p21; FGFR1 selective inhibitor PD173034 inhibits the phosphorylation of its tyrosine kinase domains thus inhibiting downstream signaling pathway.

Table 4. Summary of Clinical trials of FGFR inhibitors.

Reprints and Corporate Permissions

Please note: Selecting permissions does not provide access to the full text of the article, please see our help page How do I view content?

To request a reprint or corporate permissions for this article, please click on the relevant link below:

Academic Permissions

Please note: Selecting permissions does not provide access to the full text of the article, please see our help page How do I view content?

Obtain permissions instantly via Rightslink by clicking on the button below:

If you are unable to obtain permissions via Rightslink, please complete and submit this Permissions form. For more information, please visit our Permissions help page.