1,530
Views
0
CrossRef citations to date
0
Altmetric
Research Paper

Dexamethasone exacerbates cytotoxic chemotherapy induced lethargy and weight loss in female tumor free mice

, , &
Pages 87-96 | Received 31 Jul 2017, Accepted 15 Oct 2017, Published online: 12 Dec 2017

Figures & data

Figure 1. Mice were separated into four treatment groups; Sham, DEX, CA, and DEX + CA as described in the methods section. Mice in the Sham and CA groups were injected subcutaneously with NS on D1 to D8 of each treatment cycle (filled arrows). Mice in the DEX and DEX + CA groups were injected sq with 5 mg/kg DEX on days one to five, 2.5 mg/kg DEX on d 6 and 7, and 1.25 mg/kg on D 8. On Treatment D 3 (D3) mice in the CA and DEX + CA groups were injected i.p. with Cytoxan + Adriamycin (CA) while mice in the Sham and DEX groups were injected with the same volume of normal saline (NS).

Figure 1. Mice were separated into four treatment groups; Sham, DEX, CA, and DEX + CA as described in the methods section. Mice in the Sham and CA groups were injected subcutaneously with NS on D1 to D8 of each treatment cycle (filled arrows). Mice in the DEX and DEX + CA groups were injected sq with 5 mg/kg DEX on days one to five, 2.5 mg/kg DEX on d 6 and 7, and 1.25 mg/kg on D 8. On Treatment D 3 (D3) mice in the CA and DEX + CA groups were injected i.p. with Cytoxan + Adriamycin (CA) while mice in the Sham and DEX groups were injected with the same volume of normal saline (NS).

Figure 2. Serum levels of IL-1β, TNF-α, IL-6, GCSF, KC, and MCP-1 in mice 24-hours after CA or NS injection in the presence or absence of DEX (12 mice per group). Each bar represents the mean ± SEM of each value. P-values derived from one-way or two-way ANOVA are indicated in each figure. The threshold for detection was 3.2 pg/mL. P-values derived from one-way or two-way ANOVA are indicated in each figure.
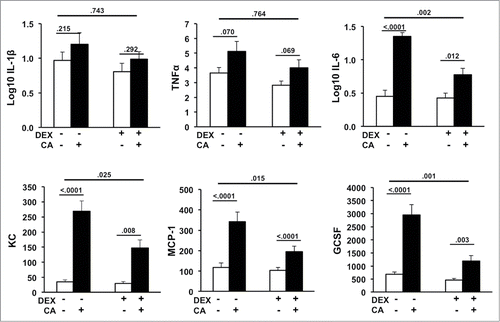
Figure 2. Serum levels of IL-1β, TNF-α, IL-6, GCSF, KC, and MCP-1 in mice 24-hours after CA or NS injection in the presence or absence of DEX (12 mice per group). Each bar represents the mean ± SEM of each value. P-values derived from one-way or two-way ANOVA are indicated in each figure. The threshold for detection was 3.2 pg/mL. P-values derived from one-way or two-way ANOVA are indicated in each figure.

Figure 3. Number of wheel turns per hour in the dark and light phase one day prior to (B) and throughout the first 8-d treatment cycle (D1 to D8) in sham and CA treated mice (Top Panel) and Dex and DEX + CA treated mice (Bottom panel). Solid arrows indicate the timing of s.q. normal saline or dexamethasone injection. Open arrows indicate the timing of CA or NS i.p. injection. Each data point represents the mean ± SEM of each value.
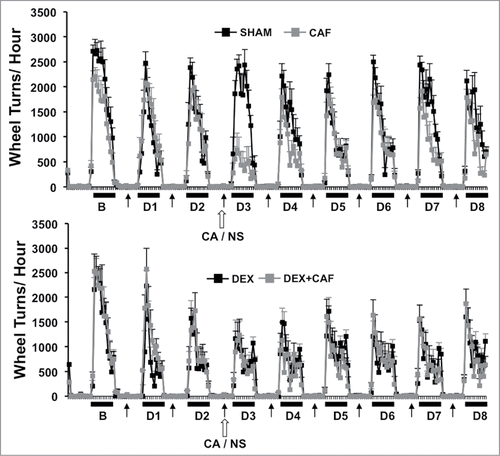
Figure 3. Number of wheel turns per hour in the dark and light phase one day prior to (B) and throughout the first 8-d treatment cycle (D1 to D8) in sham and CA treated mice (Top Panel) and Dex and DEX + CA treated mice (Bottom panel). Solid arrows indicate the timing of s.q. normal saline or dexamethasone injection. Open arrows indicate the timing of CA or NS i.p. injection. Each data point represents the mean ± SEM of each value.

Figure 4. i) total VWRA, ii) time on wheel, iii) peak VWRA, and iv) average speed (see methods section for further description of these variables) in Sham and CA-treated mice (Top Panel) and DEX and DEX+CA treated mice (Bottom Panel). Each data point represents the mean ± SEM of each value. Open arrows indicate the timing of CA or NS i.p. injection. Group differences on each day of treatment were examined by one-way ANOVA with Bonferroni correction for multiple comparisons. Follow-up post hoc tests (LSD) were performed to determine which groups differed (See results for details). Significant differences between Sham and CA-treated mice (Top panel) or DEX and DEX+CA treated mice are indicated by a *.
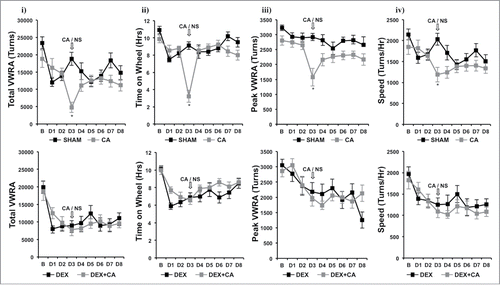
Figure 4. i) total VWRA, ii) time on wheel, iii) peak VWRA, and iv) average speed (see methods section for further description of these variables) in Sham and CA-treated mice (Top Panel) and DEX and DEX+CA treated mice (Bottom Panel). Each data point represents the mean ± SEM of each value. Open arrows indicate the timing of CA or NS i.p. injection. Group differences on each day of treatment were examined by one-way ANOVA with Bonferroni correction for multiple comparisons. Follow-up post hoc tests (LSD) were performed to determine which groups differed (See results for details). Significant differences between Sham and CA-treated mice (Top panel) or DEX and DEX+CA treated mice are indicated by a *.

Figure 5. (A) Number of wheel turns per hour in the dark and light phase during a 3-d period two- weeks after the 4th treatment cycle in sham and CA treated mice (Top Panel) and DEX and DEX + CA treated mice (Bottom panel). Each data point represents the mean ± SEM. (B) i) total VWRA, ii) time on wheel, iii) peak VWRA, and iv) speed averaged across the 3-d. Each bar represents the mean ± SEM of each value. Group differences were examined by one-way ANOVA. Significant group differences are indicated by p-values.
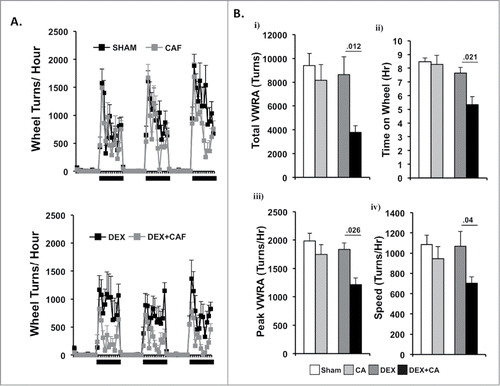
Figure 5. (A) Number of wheel turns per hour in the dark and light phase during a 3-d period two- weeks after the 4th treatment cycle in sham and CA treated mice (Top Panel) and DEX and DEX + CA treated mice (Bottom panel). Each data point represents the mean ± SEM. (B) i) total VWRA, ii) time on wheel, iii) peak VWRA, and iv) speed averaged across the 3-d. Each bar represents the mean ± SEM of each value. Group differences were examined by one-way ANOVA. Significant group differences are indicated by p-values.

Figure 6. (A) Percent change in body weight and daily food intake from the day before treatment (B) and each treatment day (D1 to D8) of the 1st cycle in sham and CA-treated mice (Top panel) and DEX and DEX+CA treated mice (Bottom Panel). Open arrows indicate the timing of CA or NS i.p. injection. Each data point represents the mean ± SEM of each value. Group differences on each day of treatment were examined by one-way ANOVA with Bonferroni correction for multiple comparisons. Follow-up post hoc tests (LSD) were performed to determine which groups differed. Significant differences between Sham and CA-treated mice (Top panel) or DEX and DEX+CA treated mice are indicated by a *.
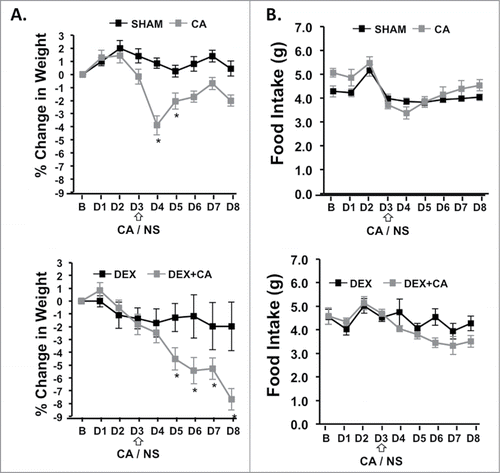
Figure 6. (A) Percent change in body weight and daily food intake from the day before treatment (B) and each treatment day (D1 to D8) of the 1st cycle in sham and CA-treated mice (Top panel) and DEX and DEX+CA treated mice (Bottom Panel). Open arrows indicate the timing of CA or NS i.p. injection. Each data point represents the mean ± SEM of each value. Group differences on each day of treatment were examined by one-way ANOVA with Bonferroni correction for multiple comparisons. Follow-up post hoc tests (LSD) were performed to determine which groups differed. Significant differences between Sham and CA-treated mice (Top panel) or DEX and DEX+CA treated mice are indicated by a *.

Figure 7. Average body weight, fat mass (FM), lean mass (LM), and bone mineral content (BMC) derived from DEXA scans performed three-weeks after the 4th treatment cycle. Each bar represents the mean ± SEM of each value. Group differences were examined using one way ANOVA with post-hoc tests. Significant group differences are indicated by the p-values.
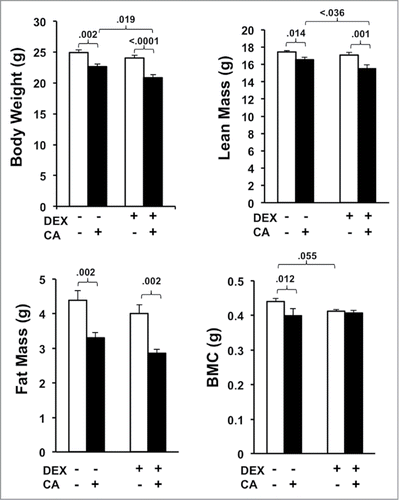
Figure 7. Average body weight, fat mass (FM), lean mass (LM), and bone mineral content (BMC) derived from DEXA scans performed three-weeks after the 4th treatment cycle. Each bar represents the mean ± SEM of each value. Group differences were examined using one way ANOVA with post-hoc tests. Significant group differences are indicated by the p-values.

Reprints and Corporate Permissions

Please note: Selecting permissions does not provide access to the full text of the article, please see our help page How do I view content?

To request a reprint or corporate permissions for this article, please click on the relevant link below:

Academic Permissions

Please note: Selecting permissions does not provide access to the full text of the article, please see our help page How do I view content?

Obtain permissions instantly via Rightslink by clicking on the button below:

If you are unable to obtain permissions via Rightslink, please complete and submit this Permissions form. For more information, please visit our Permissions help page.