
Figures & data
Figure 1. SLC6A1 was high expressed in CCRCC tissues. (A) Abnormal expression mRNAs in CCRCC tissues were reflected by the volcano plot. (B) The heat map showed SLC6A1 was a higher-expression mRNA in CCRCC tissues than in adjacent tissues. (C) SLC6A1 was high expressed in tumor tissues according to qRT-PCR. *P<0.05, compared with adjacent tissues. (D) SLC6A1 was high expressed in tumor tissues according to western blot. *P<0.05, compared with adjacent tissues. (E) Patients with lower SLC6A1 expression had higher overall survival rate and longer survival time shown by Kaplan-Meier curve. (F) An ROC curve built on a univariate classification model based on SLC6A1 expression across independent TCGA dataset for predicting CCRCC.
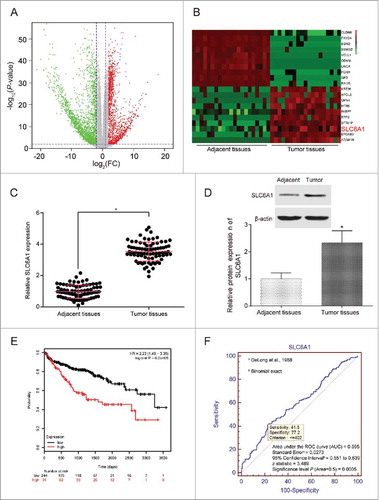
Table 1. Clinicopathologic characteristics of patients in the study.
Table 2. Univariate and multivariate analyses of clinicopathological characteristics.
Figure 2 . SLC6A1 knockdown inhibited CCRCC cells to proliferate, migrate and invade. (A) The transfection efficiency was observed by RT-qPCR. *P < 0.05, compared with control group. (B) SLC6A1 siRNA transfection inhibited the proliferation of 786-O cells. *P<0.05, compared with control group. (C-D) SLC6A1 siRNA transfection inhibited the migration and invasion of 786-O cells (200 ×). *P < 0.05, compared with control group.
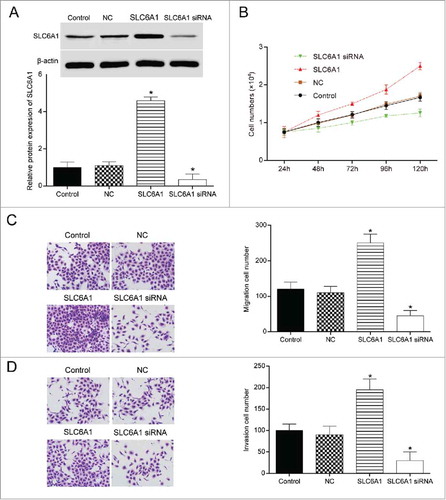
Figure 3 . MiR-200c-3p directly targeted at SLC6A1. (A) MiR-200c-3p was predicted to target SLC6A1 and the targeting scheme was illustrated. (B) MiR-200c-3p could directly targeted at SLC6A1 3’UTR. *P < 0.05, compared with NC mimics group. (C) MiR-200c-3p was low expressed in tumor tissues by qRT-PCR detection. *P < 0.05, compared with adjacent tissues. (D) MiR-200c-3p was negatively related with SLC6A1 expression with P < 0.01 and R2 = 0.524.
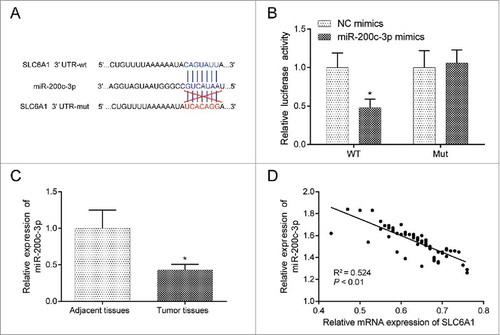
Figure 4 . MiR-200c-3p reversed the progression of SLC6A1. (A) MiR-200c-3p mimics transfection downregulated SLC6A1 expression while SLC6A1 cDNA upregulated SLC6A1 expression. *P < 0.05, compared with control group. (B) MiR-200c-3p mimics transfection decreased proliferation but SLC6A1 cDNA transfection increased proliferation in 786-O cells. Meanwhile, there was no significant difference between miR-200c-3p+SLC6A1 group and control group. *P < 0.05, compared with control group. (C-D) MiR-200c-3p mimics transfection inhibited but SLC6A1 cDNA transfection increased the migration and invasion in 786-O cells. There was no significant difference between miR-200c-3p+SLC6A1 group and control group despite of migration or invasion (200 ×). *P < 0.05, compared with control group.
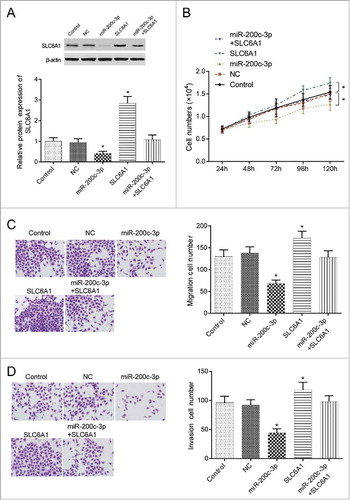
Figure 5 . Effects of the miR-200c-3p and SLC6A1 on CCRCC in vivo. (A) Tumor specimens from nude mice divided into five groups. (B) Tumor weights from nude mice divided into five groups. *P < 0.05, compared with control group. (C) The number of murine pulmonary nodules determined by dissecting microscope. *P < 0.05, compared with control group. (D) The weight of lungs in nude mice from 5 respective groups. *P < 0.05, compared with control group. (E) H&E staining was conducted to detect the number of lung metastatic nodules (× 40). *P < 0.05, compared with control group.
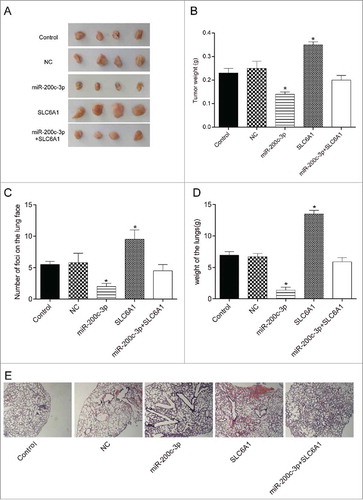
Table 3. Primer sequences used in qRT-PCR.