1,872
Views
2
CrossRef citations to date
0
Altmetric
Research Paper

In Vitro and In Vivo evaluation of a novel folate-targeted theranostic nanoemulsion of docetaxel for imaging and improved anticancer activity against ovarian cancers

, , , , , , , , , , , , , & show all
Pages 554-564 | Received 18 Aug 2017, Accepted 17 Oct 2017, Published online: 08 May 2018

Figures & data

Figure 1. Schematic representation of receptor mediated endocytosis of NMI-500 and mechanism of docetaxel cellular uptake and efflux responsible for MDR.
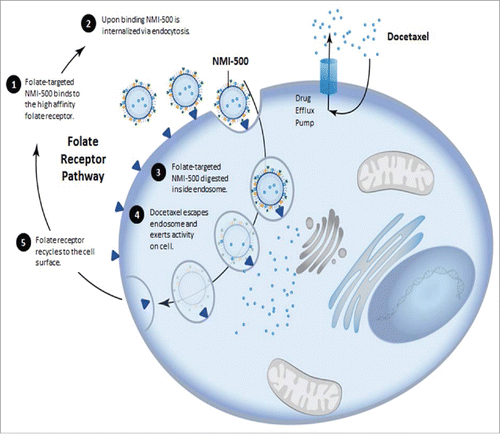
Figure 1. Schematic representation of receptor mediated endocytosis of NMI-500 and mechanism of docetaxel cellular uptake and efflux responsible for MDR.

Table 1. Characterization of NEs.

Figure 2. FA targeted nanoemulsions significantly enhances cellular uptake in FR-α positive cells. IHC staining of FR- α in (A) A2780 (B) SKOV-3 (C) KB-WT and (D) KB-PR10 cells. Flow cytometry analysis of cellular uptake of the Rh-labeled NEs with varying amount of FA in (E) KB-WT cells, (F) KB-PR10 cells with or without pretreatment with FA (1 mM).
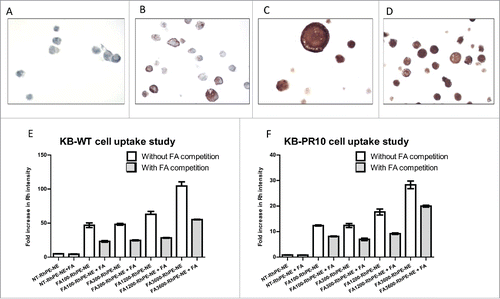
Figure 2. FA targeted nanoemulsions significantly enhances cellular uptake in FR-α positive cells. IHC staining of FR- α in (A) A2780 (B) SKOV-3 (C) KB-WT and (D) KB-PR10 cells. Flow cytometry analysis of cellular uptake of the Rh-labeled NEs with varying amount of FA in (E) KB-WT cells, (F) KB-PR10 cells with or without pretreatment with FA (1 mM).

Table 2. IC50 of docetaxel against KB-WT and KB-PR10 cells.

Figure 3. NCI-60 Human Cancer Cell Screen of NMI-500. NMI-500 was incubated with 60 different cell lines for 72 hrs and GI50 was determined. GI50 of NMI-500 was compared to GI50 of DTX for each cell line. Bars on the left of central line represent lower GI50 and bars on the right of central line represents higher GI50 for NMI-500 compared to DTX.
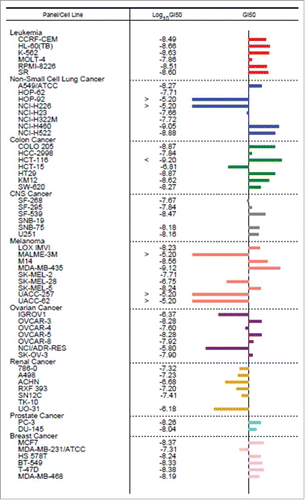
Figure 3. NCI-60 Human Cancer Cell Screen of NMI-500. NMI-500 was incubated with 60 different cell lines for 72 hrs and GI50 was determined. GI50 of NMI-500 was compared to GI50 of DTX for each cell line. Bars on the left of central line represent lower GI50 and bars on the right of central line represents higher GI50 for NMI-500 compared to DTX.

Figure 4. Pharmacokinetic profile of Taxotere, NT-NMI-500 and NMI-500. Balb/c mice were injected with formulation at 10 mg/kg of DTX intravenously via tail vein. Blood was collected at various time points and DTX concentration was measured in plasma using LC-MS. Pharmacokinetic parameters were calculated using Non-compartmental analysis using Phoenix-WinNonlin 6.2 version.
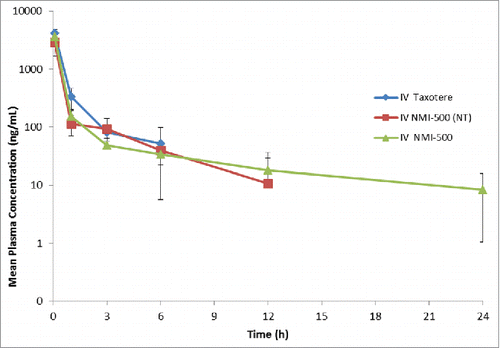
Figure 4. Pharmacokinetic profile of Taxotere, NT-NMI-500 and NMI-500. Balb/c mice were injected with formulation at 10 mg/kg of DTX intravenously via tail vein. Blood was collected at various time points and DTX concentration was measured in plasma using LC-MS. Pharmacokinetic parameters were calculated using Non-compartmental analysis using Phoenix-WinNonlin 6.2 version.

Table 3. Pharmacokinetic parameters of docetaxel administered in various formulations.

Figure 5. NMI-500 treatment inhibits ovarian tumor growth and ascites production in TgMISIIR-TAg transgenic mice. Spontaneous tumor development and growth in TgMISIIR-TAg mice was monitored by weekly magnetic resonance imaging (MRI) and drug treatment initiated when tumor volume reached ∼100 mm3. Mice were randomized into four groups (n = 20–21 mice/group) and treated with blank NE, NT-NMI-500, NMI-500 or DTX (Taxotere). (A) Tumor volumes calculated from MRI datasets at baseline (start) and after 8 weeks of treatment. (B) Tumor growth rates (slope) computed from longitudinal MRI data. (C) Total tumor volume calculated by caliper measurement of ovaries at necropsy. (D) The presence or absence of malignant ascites determined at necropsy. The MRI data for tumor growth rate were analyzed by the Wilcoxon signed-rank test, final tumor volumes by the Mann-Whitney t test and ascites fraction by the Fisher's exact two-sided test. P values less <0.05 were considered significant (*p ≤ 0.05, **p ≤ 0.01, ***p ≤ 0.001).
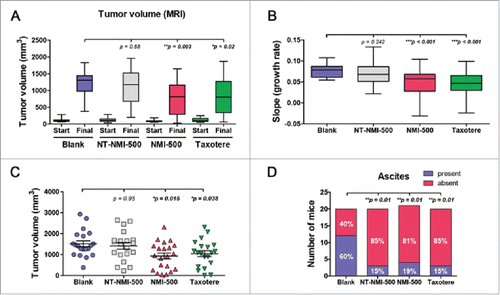
Figure 5. NMI-500 treatment inhibits ovarian tumor growth and ascites production in TgMISIIR-TAg transgenic mice. Spontaneous tumor development and growth in TgMISIIR-TAg mice was monitored by weekly magnetic resonance imaging (MRI) and drug treatment initiated when tumor volume reached ∼100 mm3. Mice were randomized into four groups (n = 20–21 mice/group) and treated with blank NE, NT-NMI-500, NMI-500 or DTX (Taxotere). (A) Tumor volumes calculated from MRI datasets at baseline (start) and after 8 weeks of treatment. (B) Tumor growth rates (slope) computed from longitudinal MRI data. (C) Total tumor volume calculated by caliper measurement of ovaries at necropsy. (D) The presence or absence of malignant ascites determined at necropsy. The MRI data for tumor growth rate were analyzed by the Wilcoxon signed-rank test, final tumor volumes by the Mann-Whitney t test and ascites fraction by the Fisher's exact two-sided test. P values less <0.05 were considered significant (*p ≤ 0.05, **p ≤ 0.01, ***p ≤ 0.001).

Figure 6. Body weight and average MRI tumor volume. NMI-500 treatment results nominal weight loss and decreased ovarian tumor growth in TgMISIIR-TAg transgenic mice. (A) Tumor weights in mice weighed weekly. (B) Average tumor volumes calculated from MRI datasets in drug and vehicle treated mice.

Figure 6. Body weight and average MRI tumor volume. NMI-500 treatment results nominal weight loss and decreased ovarian tumor growth in TgMISIIR-TAg transgenic mice. (A) Tumor weights in mice weighed weekly. (B) Average tumor volumes calculated from MRI datasets in drug and vehicle treated mice.

Figure 7. Cleaved caspase 3, phosphorylated H2AX and Ki-67 protein levels detected by immunohistochemistry in ovarian tumors in TgMISIIR-TAg mice.

Figure 7. Cleaved caspase 3, phosphorylated H2AX and Ki-67 protein levels detected by immunohistochemistry in ovarian tumors in TgMISIIR-TAg mice.
Supplemental material

sup_mat_1395118_KCBT.zip

Download Zip (307.3 KB)

Reprints and Corporate Permissions

Please note: Selecting permissions does not provide access to the full text of the article, please see our help page How do I view content?

To request a reprint or corporate permissions for this article, please click on the relevant link below:

Academic Permissions

Please note: Selecting permissions does not provide access to the full text of the article, please see our help page How do I view content?

Obtain permissions instantly via Rightslink by clicking on the button below:

If you are unable to obtain permissions via Rightslink, please complete and submit this Permissions form. For more information, please visit our Permissions help page.