Figures & data
Table 1. The primary characteristics of 98 patients with mCRC.
Figure 1. Immunohistochemistry of TOPO-1 in CRC tissues. (A) High expression of TOOPO-1. (B) Low expression of TOPO1. Scale bar = 100 µm.
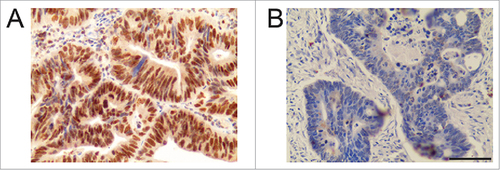
Figure 2. Immunohistochemistry of CES-2 in CRC tissues. (A) High expression of CES-2. (B) Low expression of CES-2. Scale bar = 100 µm.
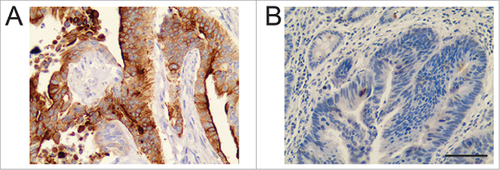
Table 2. The correlation of TOPO-1 and CES-2 expression in patients.
Table 3. The correlation between TOPO-1 expression and clinicopathological characteristics in mCRC patients.
Table 4. The correlation between CES-2 expression and clinicopathological characteristics in mCRC patients.
Table 5. The correlation of TOPO-1 and CES-2 expression in mCRC with curative effect.
Table 6. Compare the expression of TOPO-1, CES-2 in mCRC and the curative effect.
Figure 3. ROC curves analysis of TOPO-1 and CES-2 expression in the CRC tissues. (A) ROC curve for TOPO-1 discriminates the curative effect. (B) ROC curve for CES-2 discriminates the curative effect.
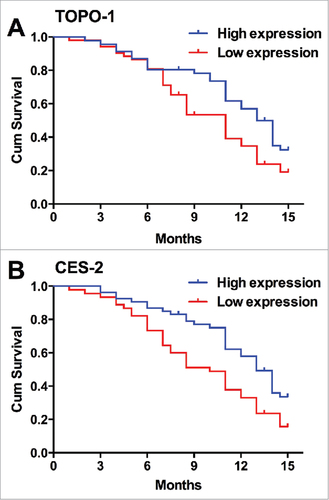
Figure 4. The relationship between TOPO-1 expression/CES-2 expression and the PFS in patients with mCRC. (A) Kaplan-Meier curves for PFS in mCRC patients correlation with TOPO-1 expression in CRC tissues (P = 0.00101). (B) Kaplan-Meier curves for PFS in mCRC patients correlation with CES-2 expression in CRC tissues (P = 0.046).
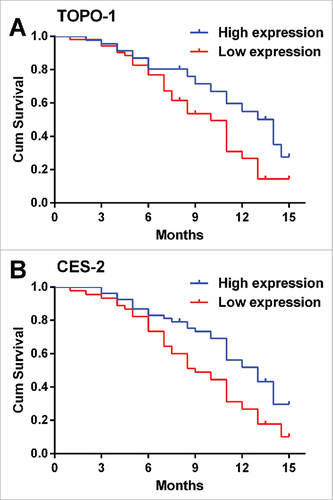
Figure 5. The relationship between TOPO-1 expression/CES-2 expression and the OS in patients with mCRC. (A) Kaplan-Meier curves for OS in mCRC patients correlation with TOPO-1 expression in CRC tissues (P = 0.00273). (B) Kaplan-Meier curves for OS in mCRC patients correlation with CES-2 expression in CRC tissues (P = 0.0077).