Figures & data
Figure 1. Compared to the control group, NME2 expression was high in OS cell lines and clinical OS tumor tissues. (A) RT-PCR confirmed that the mRNA expression of NME2 was significantly higher in MNNG/HOS and MG63 cell lines than in hFob1.19 cell lines. (B) NME2 protein was overexpressed in MNNG/HOS and MG63 cell lines compared to hFob1.19. (C) The mRNA expression levels of NME2 in clinical tumor tissues were significantly higher than in the corresponding adjacent non-tumor tissues. (D) RT-PCR demonstrated that the NME2 expression in tumor tissues was 65% higher than in non-tumor tissues.
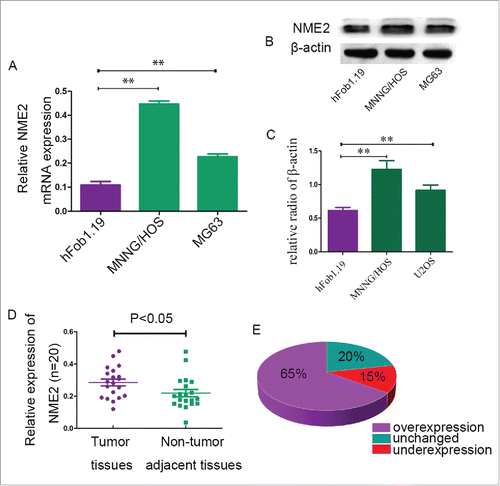
Figure 2. The downregulation of NME2 expression in osteosarcoma cell lines affects cell proliferation. (A) Compared to si-NC targeted MNNG/HOS cells, NME2 expression was significantly downregulated in si-NME2 targeted MNNG/HOS cells at the mRNA and protein levels. (B) Compared to si-NC targeted MG63 cells, NME2 expression at the mRNA and protein levels was significantly downregulated in the si-NME2 targeted MG63 cells.(C) The proliferation of si-NC targeted MNNG/HOS cells was significantly higher than that of si-NME2 transfected MNNG/HOS cells from the 3rd day. (D) The proliferation of MG63 cells was significantly lower from the 3rd day onwards when transfected with si-NME2 compared to those transfected with si-NC.
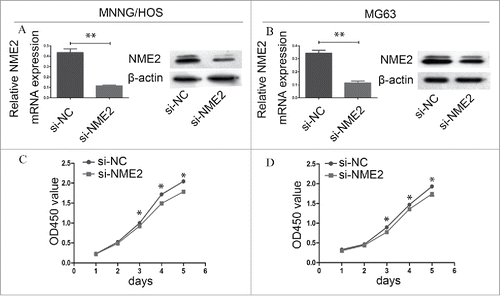
Figure 3. Cells were significantly arrested in the G2/M phase, when the expression of NME2 was knocked down in MNNG/HOS and MG63 cells. (A) In the si-NC transfected MNNG/HOS cell line, the cell cycle assay showed that 37.51% ± 1.57% of the cells were in the G1 phase, 7.84% ± 0.65% of the cells were in the G2 phase and 54.65% ± 1.81% of the cells were in the S phase. (B) In the si-NME2 transfected MNNG/HOS cell line, the cell cycle assay showed that 38.61% ± 0.76% of the cells were in the G1 phase, 14.18% ± 1.06% of the cells were in the G2 phase and 47.20% ± 1.78% of the cells were in the S phase. (C) The cell cycle was arrested in the G2/M phase after the transfection of si-NME2 in the MNNG/HOS cell line. (D) In the si-NC transfected MG63 cell line, the cell cycle assay showed that 37.64% ± 2.07% of the cells were in the G1 phase, 8.75% ± 1.43% of the cells were in the G2 phase and 53.61% ± 1.03% of the cells were in the S phase. (E) In the si-NME2 transfected MG63 cell line, the cell cycle assay showed that 35.48% ± 2.36% of the cells were in the G1 phase, 14.12% ± 1.96% of the cells were in the G2 phase and 50.40% ± 4.31% of the cells were in the S phase. (F) The cell cycle was arrested in the G2/M phase after the transfection of si-NME2 in the MG63 cell line. Error bars represent Standard Deviation.
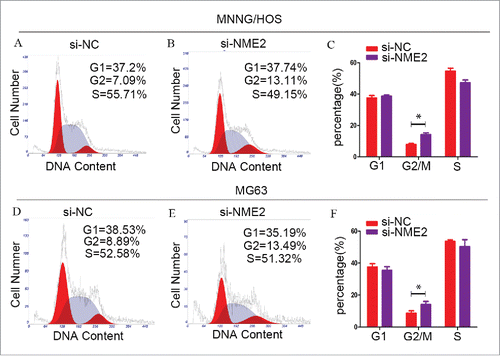
Figure 4. The clone forming assay showed that the number of colonies was significantly reduced when the expression of NME2 was knocked down in the MNNG/HOS (A) and MG63 (B) cell lines. (C) NME2 expression in adjacent non-tumor tissues (D) NME2 expression in tumor tissues (E) c-Myc expression in adjacent non-tumor tissues (F) c-Myc expression in tumor tissues. The tumor cells show cytoplasmic staining. All images were captured at 200 × magnification.
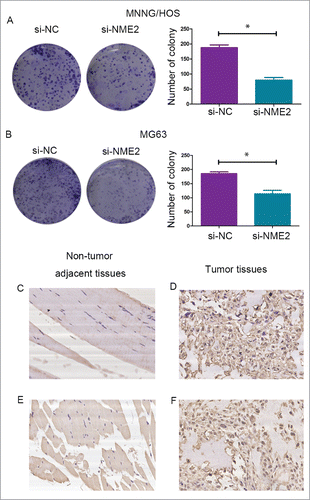
Table 1. Relationship between NME2 IHC results and clinical information for 50 OS patients.
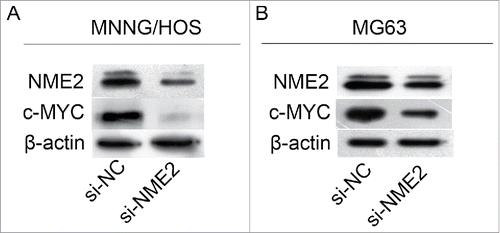
Figure 5. NME2 could upregulate c-Myc expression to affect the proliferation of OS cells. Western blots demonstrated that when the expression of NME2 was knocked down in MNNG/HOS and MG63 cells, c-Myc expression was also downregulated in MNNG/HOS (A) and MG63 (B).