Figures & data
Figure 1. Evaluation of OAd-mediated cytopathic effect (CPE) and TMZ induced-cytotoxicity in murine cancer cells. (A) Murine lung cancer KPCL and TC-1 cell lines were infected with Adhz60 at a multiplicity of infection (MOI) concentration of 0, 10, 25, 50 and 100. At 72h post-infection, crystal violet staining was used to evaluate CPE. A representative staining is shown of three experiments performed. (B) OAd-mediated CPE was calculated by measuring the absorbance of solubilized dye at 590 nm. Each point represents the mean of three independent experiments ± standard deviation (SD; bars). (C) Supernatants were collected and used to determine adenovirus yield from each cell line. Results represent the mean of three independent experiments ± standard deviation (SD; error bars) (#P < 0.05). (D) The cell lines above-mentioned were treated with TMZ at concentrations of 0, 50, 100, 200, and 400 µM. A MTT assay was used to determine cell survival at 72h post-treatment. Each point represents the mean of three independent experiments ± standard deviation (SD; bars).
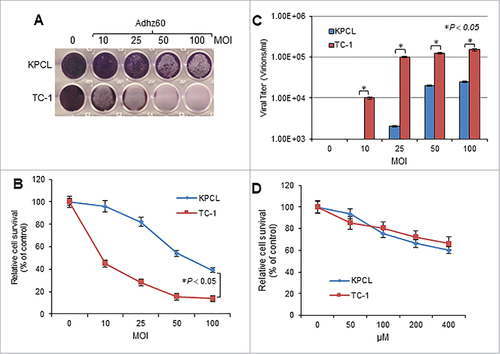
Figure 2. Effect of combined therapy of TMZ and OAd on virus replication in murine cancer and non-cancerous cells. (A) Murine cancer KPCL and TC-1 and non-cancerous MM14.Lu cells were treated with Adhz60 and TMZ at the following doses for Adhz60 and TMZ, respectively 10 MOI and 400 µM. AdLacZ was used at 10 MOI for all cell lines. DMSO was added as a control at its respective volume for each cell line. At 72h post-infection, crystal violet staining was used to evaluate CPE. A representative staining is shown of three experiments performed. (B) OAd-mediated CPE was calculated by measuring the absorbance of solubilized dye at 590 nm. Results represent the mean of three repeated measurements ± standard deviation (SD; error bars) (*P < 0.05 for all cell lines). (C) Expression of adenovirus E1A proteins were detected with an anti-adenovirus type 5 E1A monoclonal antibody. Actin was used as a loading control. A representative experiment is shown from three performed. (D) Supernatants from were used to determine adenovirus yield from each cell line. Results represent the mean of three independent experiments ± standard deviation (SD; error bars) (*P < 0.05).
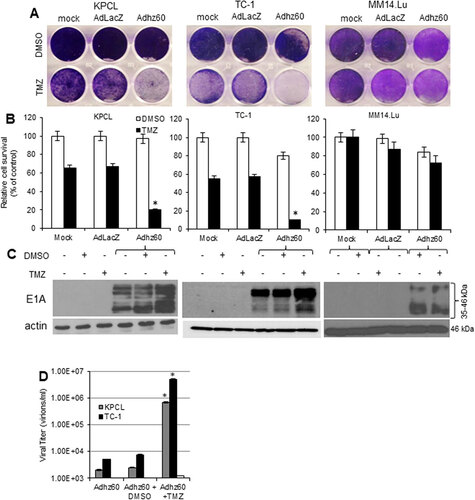
Figure 3. Evaluation of Adhz60 and TMZ combined therapy-induced apoptosis. Murine cancer cells were untreated or treated with DMSO, TMZ, and Adhz60-alone, or in combination as described in . (A) At 72 h post-treatment, murine cancer cells were stained with annexin V-PE and 7-aminoactinomycin D (7-AAD). Positive cells for annexin V-PE and 7-AAD staining were analyzed by FACScan flow cytometer with FlowJo software. (B) Results represent the mean of three independent experiments ± standard deviation (SD; error bars) (*P < 0.05). (C) Whole cell protein lysates were collected 72h after indicated treatment. Expression of cleaved caspase-3 was detected by Western blotting. Actin was used as a loading control. A representative experiment is shown from three performed.
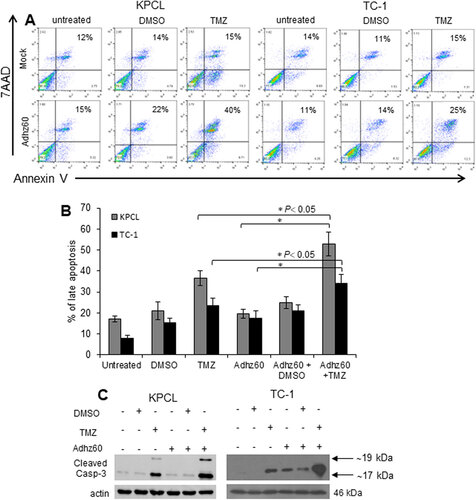
Figure 4. Evaluation of combined therapy ability to induce autophagy in mouse cancer cells. (A) Murine cancer cells were transfected with pEGFP-LC3 followed by untreated or treated with TMZ at 400 µM or Adhz60 at an MOI concentration of 10 alone or in combination. Integration of GFP-LC3 into the autophagosome is depicted by punctate structures and was analyzed by fluorescence microscopy at 48h post-treatment. Images were taken at 40× magnification with the EVOS FL Imaging System (Advanced Microscopy Group) under 357/44 (nm) and 447/60 (nm) excitation and emission visualization. Comparison of number of GFP dots per cell in untreated cells or treated with TMZ, Adhz60 or combination of both. A representative experiment showing punctate (arrows) is shown from three performed. (B) Comparison of number of GFP dots per cell in untreated or treated cells with TMZ, Adhz60 or combination of both. A representative experiment is shown from three performed. (C)Whole cell protein lysates were collected 72h after indicated treatment. Western blot and bar graphs of LC3-I and II expressions. Bars represent mean ± SEM expressed as percentage of change from 3 separate experiments, (#P < 0.05) decrease in the level of LC3-I expression. Actin was used as a loading control.
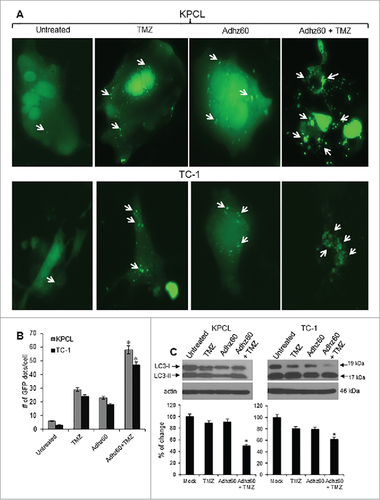
Figure 5. Effect of TMZ on OAd-mediated CPE in murine triple negative breast cancer cells. 4T1 Murine breast cancer cells were no treated (Mock) or treated with Adhz60 and TMZ at the following doses for Adhz60 and TMZ, respectively: (10 MOI and 400 µM). AdLacZ was used at 10 MOI. DMSO was added as a control. (A) Cytopathic effect was evaluated by crystal violet staining at 72 hours following treatment and reported as percentage of control (mock). (B) Cell viability was calculated by measuring the absorbance of solubilized dye at 590 nm. Results represent the mean of three repeated measurements ± standard deviation (SD; error bars) (#P < 0.05). (C) Seventy-two hours post-treatment, supernatants were collected and used to determine virus adenovirus yield from each cell line. Results represent the mean of three independent experiments ± standard deviation (SD; error bars) (##P < 0.01). (D) Whole cell protein lysates were collected 72h after indicated treatment. Western blot and bar graphs of LC3-I and II expressions. Bars represent mean ± SEM expressed as percentage of change from 3 separate experiments, (#P < 0.05) decrease in the level of LC3-I expression. Actin was used as a loading control. (E) Cells were stained with annexin V-PE and 7-aminoactinomycin D (7-AAD). Positive cells for annexin V-PE and 7-AAD staining were analyzed by FACScan flow cytometer. (F) Results represent the mean of three independent experiments ± standard deviation (SD; error bars) (#P < 0.05). (G) Whole cell protein lysates were collected 72h after indicated treatment. Expression of cleaved caspase-3 was detected by western blot; actin was used as a loading control. A representative experiment is shown from three performed.
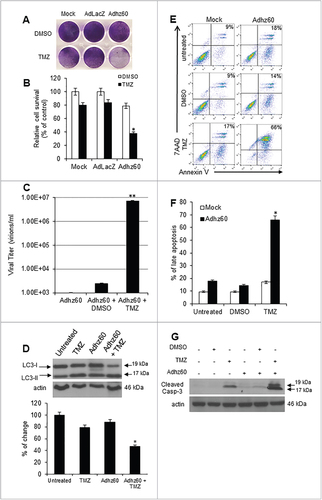
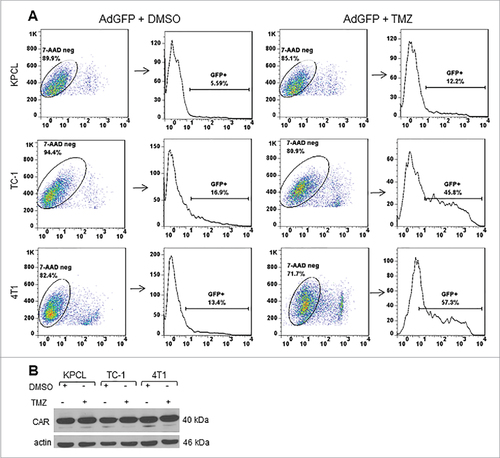
Figure 6. Effect of TMZ on Ad transduction efficiency and expression of coxsackie adenovirus receptor. Murine cancer cells were infected with AdGFP at an MOI of 10 followed by DMSO or TMZ at 400 µM. (A) Forty-eight h post treatment, cells were collected and GFP expression was analyzed by FACScan flow cytometer (Becton Dickinson, Franklin Lakes, NJ) and with FlowJo software (Tree Star Inc., Ashland, OR). A representative experiment is shown from three performed. (B) Expression of coxsackie adenovirus receptor was detected with an antibody that can recognize both human and mouse CAR. Actin was used as a loading control, a representative experiment is shown from three performed.