Figures & data
Table 1. The sequence for primers and Smart Silencer Target Sequence.
Table 2. Correlation between CEBPA-AS1 expression and clinical pathological parameters of OSCC patients (n = 60).
Figure 1. CEBPA-AS1 is an independent prognosis factors in OSCC patients. A, volcano plots of lncRNA array in 4 paired OSCC and control tissues. B, clustering map of CEBPA-AS1 in 4 paired OSCC and control tissues. 1T-4T: OSCC tissues, 1P-4P: control tissues. C, qRT-PCR assay of the CEBPA-AS1 expression levels in OSCC tissues (n = 60). # means P < 0.01 verse NT. D, qRT-PCR assay of the CEBPA-AS1 expression levels in OSCC cells. E: Kaplan-Meier overall survival curves by CEBPA-AS1 expression level. # means P < 0.05 and # means P < 0.01 verse hNOK.
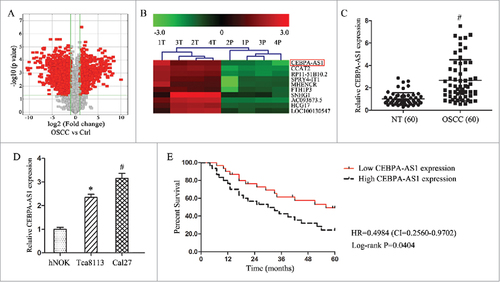
Table 3. Influence of CEBPA-AS1 expression and clinical characteristics on overall survival in OSCC patients (n = 60).
Figure 2. Modulation of CEBPA-AS1 expression effects cell proliferation, cell apoptosis and cell invasion in OSCC cells. BC, blank control group; NC, negative control smart silencers transfection group; SS, CEBPA-AS1 smart silencers transfection group. Each bar represents triplicate analyses of mean ± SD and # means the significant difference from the negative control (P < 0.05). A, qRT-PCR detects the CEBPA-AS1 smart silencers transfection efficiency. B and C, cells proliferation ability was determined by MTT assay. D and E, cells proliferation ability was determined by EDU assay. F and G, cells apoptosis were stained for Annexin V/PI and analyzed by flow cytometry. The percentage of cells positive for Annexin V and negative for PI staining are considered as early apoptosis. The percentage of cells positive for Annexin V and PI staining are considered as late apoptosis. Each of them was presented in quadrant. H and I, the invasive potential of CEBPA-AS1 in OSCC cells was examined by transwell invasion assay (visual field representative of 1 experiment). J and K, the migration potential of CEBPA-AS1 in OSCC cells was examined by a wound healing assay. The percent surface area between the wounds was determined using NIS elements software.
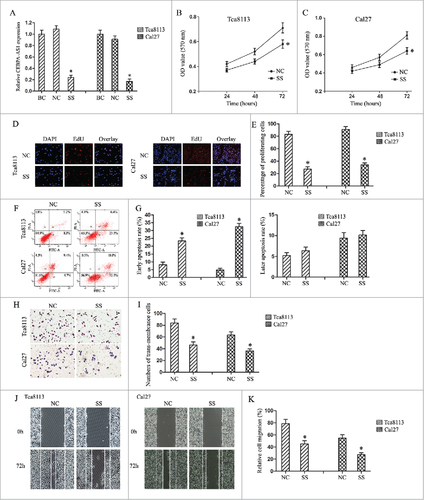
Figure 3. Localization of CEBPA-AS1 by RNA-FISH in OSCC cells. Nuclei are stained blue (DAPI), 18S (Cytoplasm positive), U6 (Nuclei positive) and CEBPA-AS1 labeled with CY3 are stained red. Magnification is 60 × with 4.5 × zoom.
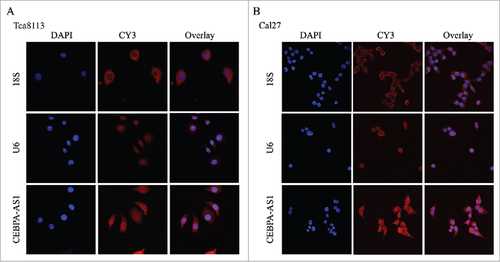
Figure 4. CEBPA-AS1 represses CEBPA/Bcl2 expression via targeting CEBPA in OSCC cells. All data were represented as the mean ± S.D. from three independent experiments, #P < 0.05. A, relative CEBPA levels in OSCC are detected by qPCR. B, the co-expression patterns between CEBPA and CEBPA-AS1 in head and neck squamous cell carcinoma is searched using the online server ChIPBase. C, CEBPA-AS1 RNA levels was detected in the substrate of pull-down assay by qRT-PCR. CEBPA-mut probe was used as negative control. D, CEBPA mRNA level was detected in the substrate of pull-down assay by qRT-PCR. CEBPA-AS1-mut probe was used as negative control. E and F, the level of CEBPA and Bcl2 mRNA are determined by qRT-PCR when CEBPA-AS1 down-regulated in OSCC cells. G-I, the level of CEBPA and Bcl2 protein are determined by western blot when CEBPA-AS1 down-regulated in OSCC cells. β-actin was used as reference control.
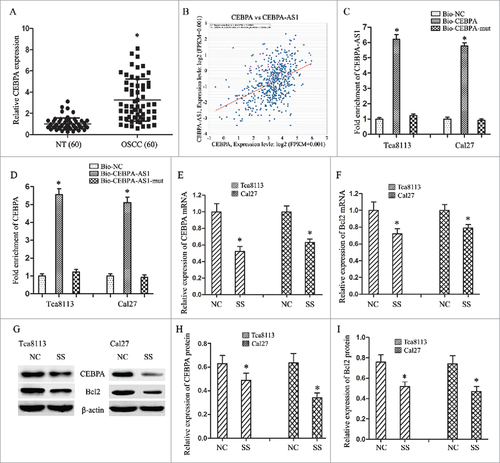
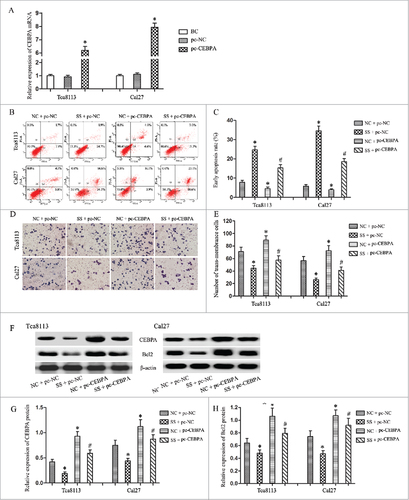
Figure 5. CEBPA promotes the CEBPA-AS1 associated tumorgenesis in OSCC cells by alleviated CEBPA and Bcl2 expression. Each bar represents triplicate analyses of mean ± SD, # means the significant difference from the NC + pc-NC control (P < 0.05) and # means the significant difference from the NC + pc-CEBPA group (P < 0.05). A, qRT-PCR detects the CEBPA vectors or the empty vectors transfection efficiency. B and C, cells apoptosis were analyzed by flow cytometry. D and E, the invasive ability was examined by transwell invasion assay. F-H, the level of CEBPA and Bcl2 protein are determined by western blot. β-actin was used as reference control.