
Figures & data
Figure 1. (A) Stromal TIL negative group (score 0): almost no lymphocytic infiltration into the stroma of surrounding cancer cell nests; (B) Stromal TIL negative group (score 1): low lymphocytic infiltration into the stroma of surrounding cancer cell nests; (C) Stromal TIL positive group (score 2): moderate lymphocytic infiltration into the stroma without tumor cell nest permeation and (D) Stromal TIL positive group (score 3): intense lymphocytic infiltration into the stroma and between tumor cells. (E) and (F): Representative figure of stromal TILs at modetate scores in the same tissue section verified by HE and the expression of CD45 by immunohistochemistry, respectively. (G) and (H): Representative figure of stromal TILs at low scores based on HE stainings in the same tissue section verified by the expression of CD45 by immunohistochemistry. [100 × magnification, H & E-stained sections or IHC sections. (A-E, G); 100 × magnification, IHC section (F, H)]. Abbreviations: TIL = tumor-infiltrating lymphocyte.
![Figure 1. (A) Stromal TIL negative group (score 0): almost no lymphocytic infiltration into the stroma of surrounding cancer cell nests; (B) Stromal TIL negative group (score 1): low lymphocytic infiltration into the stroma of surrounding cancer cell nests; (C) Stromal TIL positive group (score 2): moderate lymphocytic infiltration into the stroma without tumor cell nest permeation and (D) Stromal TIL positive group (score 3): intense lymphocytic infiltration into the stroma and between tumor cells. (E) and (F): Representative figure of stromal TILs at modetate scores in the same tissue section verified by HE and the expression of CD45 by immunohistochemistry, respectively. (G) and (H): Representative figure of stromal TILs at low scores based on HE stainings in the same tissue section verified by the expression of CD45 by immunohistochemistry. [100 × magnification, H & E-stained sections or IHC sections. (A-E, G); 100 × magnification, IHC section (F, H)]. Abbreviations: TIL = tumor-infiltrating lymphocyte.](/cms/asset/3dc54abb-b81d-4a01-b189-ee1dd43db89d/kcbt_a_1416932_f0001_oc.jpg)
Table 1. Comparison of quantitative clinical factors between according to stromal tumor-infiltrating lymphocytes negative group and positive group.
Table 2. Univariate analysis of clinical characteristics according to stromal tumor-infiltrating lymphocytes.
Table 3. Univariate and multivariate analysis of clinicopathologic variables in relation to liver metastasis and overall survival after curative operation.
Figure 2. Plot of the overall survival for all patients stratified based upon TIL groups. Abbreviations: TIL = tumor-infiltrating lymphocyte.
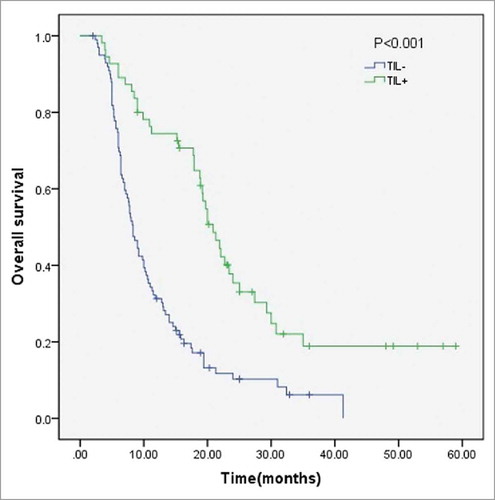
Figure 3. Plot of the liver metastasis-free survival for all patients stratified according to TIL groups. Abbreviations: TIL = tumor-infiltrating lymphocyte.
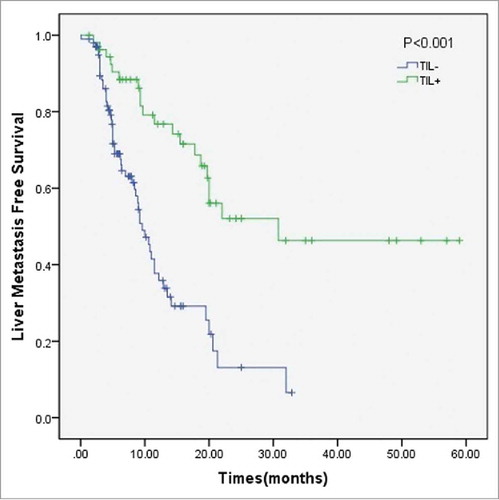
Figure 4. Comparison of the monoculture, indirect co-culture, and direct co-culture of the three cell lines (Panc-1, MiaPaCa-2 and AsPC-1) at 3 days. The co-culture (both indirect co-culture, and direct co-culture) with lymphocytes markedly limited the proliferation of pancreatic cancer cell lines, and many cancer cells showed evidence of apoptosis, such effect are much more evident in indirect co-culture. The quantitative results of 6 parallel groups are shown in a histogram, cell counting of both the direct co-culture and the indirect co-culture are significantly lower than monoculture in all three pancreatic cancer cell lines. (* P < 0.05, **P < 0.01).
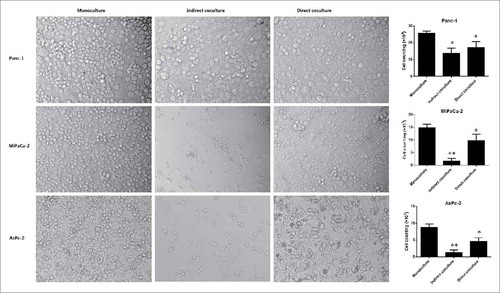
Figure 5. CCK8 assay to test the function of lymphocytes on pancreatic cancer cells (Panc-1, MiaPaCa-2 and AsPC-1). The co-culture with lymphocytes inhibited pancreatic cancer cell growth. (monoculture: pancreatic cancer cell culture alone, co-culture: pancreatic cancer cells culture with lymphocytes. * P < 0.05).
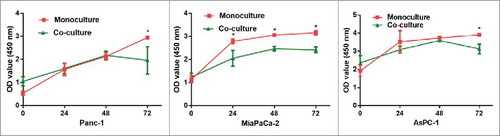
Figure 6. ELISA experiments to test the possible cytokines secreted from lymphocytes on pancreatic cancer cells (Panc-1, MiaPaCa-2 and AsPC-1). The co-culture with lymphocytes inhibited pancreatic cancer cell growth. Cocultures of lymphocytes and cancer cells at a 4:1 ratio increased the secretion of IL-8 and TNF-alpha in the culture media compared with at a ratio of 1:1, and much higher than lymphocytes or cancer cells alone(A and C). IL-6, IL-1and IL-12 are also secreted significantly, but there were no significant additive effects in the coculture groups (E, H and I). There was no significant change in the TGF-beta, EGF, MMP9 and GM-CSF concentration among the experimental groups (B, D, F and G). (P: Panc-1; M: MiaPaCa-2; A: AsPC-1: D: direct coculture; I: indirect coculture).
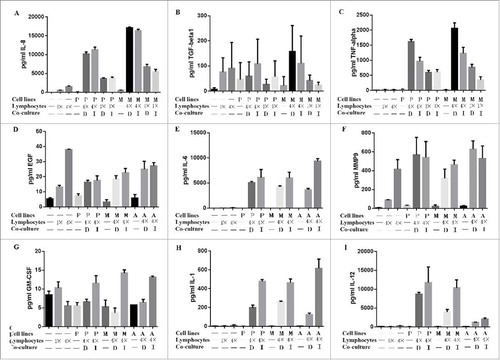
Figure 7. Comparison of the TNF-alpha positive and TNF-alpha negative of the three cell lines (Panc-1, MiaPaCa-2 and AsPC-1) at 3 days. TNF-alpha significantly limited the proliferation of pancreatic cancer cell lines (* P < 0.05, **P < 0.01).
